1. Introduction
The Ocean Carriers has declined rapidly since the 2008 global financial crisis, causing the collapse of Hanjin Shipping Co., the nation`s sole global Carrier, in 2015. In 2007, prior to the global financial crisis, only 19 ocean carriers with a deficit in the gross pre-tax net profit rate were in the red, but management debt is still showing no signs of improvement, from 2008 to 35 and 2011 to 67 carriers, 2015 to 56 carriers and 2018 to 40 carriers. The debt-to-equity rate was also 158 % in 2007, but it surged to 197 % in 2008 and peaked at 562 % in 2013 and has continued to decline since then, with 186 % but still high in 2018. Competition in the global shipping market has intensified as the protracted global economic slump and the competition to build large-scale green ships have accelerated, intensifying the oversupply of ships on board. Therefore, because carriers that are inefficient in managing their fleet size or management are hard to survive in global competition, restructuring such as strategic alliance and M&A will be inevitable.
In this study, the management efficiency of ocean carriers with different management control was not only tested, but also analyzed the relevance among the major factors affecting them. The purpose of this study is to enhance the global competitiveness of the Korean Ocean carrier by drawing out measures that can improve management efficiency.
2. Managerial Analysis by Ship Type of Ocean Carriers
2.1 Analysis of Scale Trends by ship type
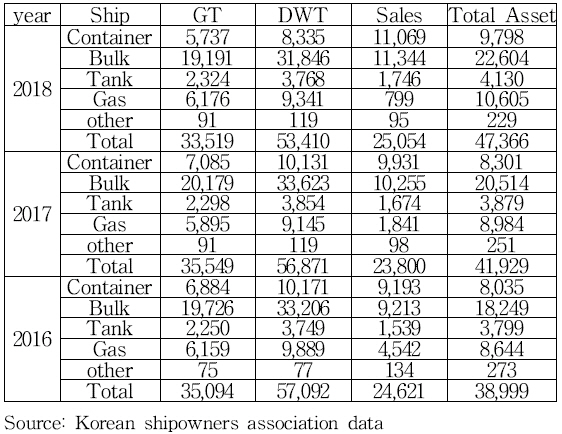
At Table
1, the total Gross tonnage(GT) and dead weight tonnage(DWT) of the korean ocean carriers (116 carriers) decreased slightly from 35,094 tons and 57,092 tons respectively to 33,519 tons and 53,410 tons in 2018, but their combined sales and assets increased by 4.5 % and 6.4 % from 24.61 trillion won and 38.99 trillion won to 36.5 trillion won and 34.4 trillion won (15 trillion won). In terms of total tonnage, the container weight decreased by about 2.5% from 19.6% in 2016 to 17.1% in 2018, while bulk, tanker, gas and other ships increased somewhat. Sales, however, greatly increased from 37.3 % and 37.4 % to 44.2 % and 45.3 % for containers and bulk, while those for gas ships dropped significantly from 18.4 % to 3.2 %. And the total asset rate does not change much in all varieties, with containers slightly increasing from 20.6% to 20.7% and bulk from 46.8% to 47.7%.
Table┬Ā1
Scale(total) trend of Korean Ocean Carriers (unit: thousand G/T, billion won)
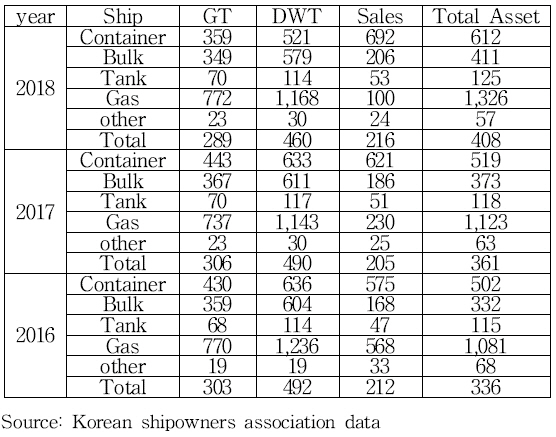
If you look at the average of Table
2 per company, the total tonnage of containers has decreased by a whopping 16.7 % from 43 million GT in 2016 to 349,000 GT in 2018, but other types of vessels are showing marginal changes. In other words, bulk carriers declined 2.7 %, while tanker and gas ships increased 3.3 % and 0.3 %, respectively. However, container and bulk sales increased 20.4 % and 23.1 % in 2016 right after Hanjin Shipping's bankruptcy, while total assets increased 21.9 % and 23.9 %.Gas ships, on the other hand, saw a 22.7% increase in total assets, but a significant 82.4% decrease in sales. The total tonnage of tanker ships increased by a small margin of 3.3% in 2018 compared to 2016, but sales and total asset size increased by 13.5% and 8.7%, respectively.
Table┬Ā2
Scale(average) trend of Korean Ocean Carriers (unit: thousand G/T, billion won)
2.2 Profitability Trends Analysis by ship type
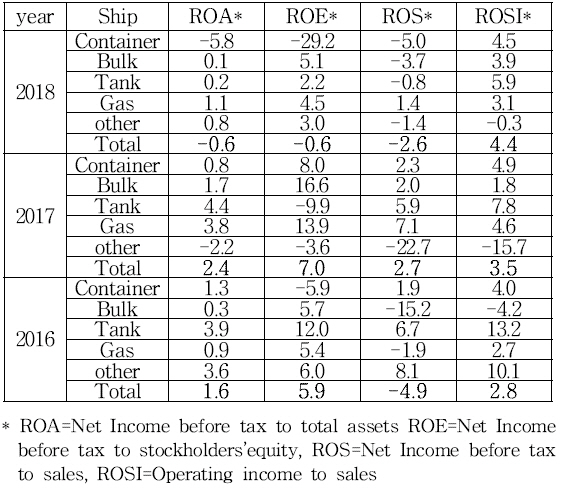
When looking at Table
3's overall profitability of foreign carriers, it appears that asset profitability (ROA) and return on capital (ROE) have deteriorated from 1.6% and 5.9% to -0.6%, while ROS (return on sales) and ROSI (operating profitability) have improved from -4.9% and 2.8% to - 2.6% and 4.4%.
Table┬Ā3
Profitability trend of Korean Ocean Carriers (unit: %)
In terms of ship type, except for the profit margin of sales operatens, the return on assets/capital and sales was significantly worse in 2018 compared to 2016 when ROA, ROE, ROS and ROSI of container ships were 1.3% --5.8%, -5.9% --29.2%, 1.9% -5% and 4% - 4.5% respectively. All profitability indicators of the tanker ships are significantly deteriorated, with ROA, ROE, ROS, and ROSI at 3.9%-0.2%, 12%-2.2%, 6.7%-0.8%, 13,2%-5.95%, respectively, leading to worsening profitability of ocean carriers by containers and tankers. Although there was no significant change in the return on assets and capital of bulk carriers, the return on pre-tax sales improved from 1515.2% to 5%5% and the return on sales operatens improved from 4% to 4.5%. Compared to 2016, ROA, ROE, ROS, and ROSI improved to 0.9% - 1.1%, 5.4% - 4.5%, -1.9% - 1.4%, and 2.7-.1% 3.1% in 2018, respectively, showing the best profitability of gas ships.
2.3 Financial ability Analysis by ship type
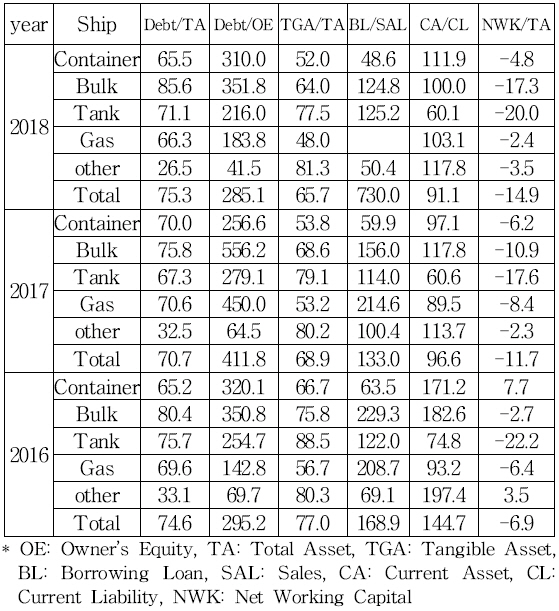
According to Table
4, overall ocean carriers, Debt/TA edged up from 74.6% to 75.3%, but Debt/OE decreased by 10%, from 320.1% to 310%. Other ships are the lowest at 69.5%_>41.5% followed by gas vessels deteriorating from 142.8% to 183.8%, tanker vessels improved from 254.7% to 216%, bulk carriers did not change much from 350.8% to 351.8%. Container ships saw their debt rate decrease by 10 % from 320.1 % to 310 %. The rate of tangible asset to total asset(ta/TA) and the rate of borrowing to sales(BL/SAL) have also decreased by ship type, and the rate of current(CA/CL) and net working capital to total asset(NWK/TA) have also decreased in all ship types, worsening liquidity.
Table┬Ā4
Financial Structure of Korean Ocean Carriers (unit: %)
2.4 Analysis of Efficiency and Productivity Trends by ship type
According to Table
5, total asset turnover (Sal/TA) and management asset turnover (Sal/MA) decreased from 94.4% and 125.8% to 89.2% and 92.3%, respectively, in 2018 compared to 2016, resulting in a deterioration in the efficiency of total assets and management assets. By the ship type, containers deteriorated significantly from 139.2% and 196.2% to 99.2% and 103%, while bulk's total asset turnover was slightly revised from 104.2% to 109.4%, but its management assets deteriorated from 140.6% to 113.5%.
3. Theoretical Background and Literature Review
3.1 Theoretical Background
Efficiency is defined as the rate of the output compared to the input, with the output expected with the minimum input. The higher the rate, the more efficient it is rated. However, this concept is useful in assessing the efficiency of a single input and a single output, but it is not possible to consider all of the inputs and outputs, and in practice it is common to produce a number of outputs using a number of inputs. Therefore, the analysis of efficiency should also be calculated by weighting multiple inputs and multiple outputs, depending on each decision unit (DMU).(Efficiency = sum of Output weighting/sum of input weighting)
1). Efficiency is relative, and the difficulty exists in finding a common set of weights to determine relative efficiency.
Therefore, data envelopment analysis(DEA) method, a linear planning technique that measures the relative performance of organizations with multiple inputs and multiple outputs by selecting the best weights for each decision unit (DMU) was presented.
3.2 Literature Review
Zhang(2014) presented measures to improve efficiency by analyzing the efficiency of major carriers in Korea and China before and after the financial crisis by DEA model. Among the 22 carriers in Korea, four are Korean carriers with one CCR efficiency. There are six carriers with 1 BCC efficiency, five of which are Korean carriers and one is Chinese. Chinese carriers were analyzed to be more inefficient than Korean carriers.
In the
Kim(2017) study, 100 ocean carriers registered with the Shipowners' Association were analyzed for three years from 2013 to 2015 to measure changes in management efficiency and scale efficiency. According to the analysis, 61 DRS carriers were in 2013, 54 in 2014 and 69 in 2015 that could improve efficiency through increased operational efficiency. The number of IRS carriers that can increase efficiency through scale expansion decreased from 22 in 2013 to 12 in 2015. Meanwhile, analysis of logit and probit models also tested the appropriateness of input and output variables.
The
Park(2012) study analyzed the efficiency of global logistics enterprises at home and abroad from 2005 to 2010 using DEA and Malmquist productivity indices. According to the empirical analysis results, the efficiency of ocean global logistics carriers is generally higher than that of domestic global logistics carriers, including scale efficiency. The
Chung(2008) study analyzed the process of changing management efficiency of global container carriers at home and abroad for three years from 2004 to 2006. M, the world's No. 1 global carrier, briefly lost efficiency but recovered after acquiring P, the world's No. 3 shipper at the time. H, Korea's leading global Carrier at that time, suggests that Korea's operational efficiency lags behind that of the three major global or Japan's (NYK, MOL and K-Line).
The
Chung(2007) study analyzed management efficiency of 25 carriers with more than 50 billion won in sales and a surplus in 2005 among Korean national flag carriers using the CCR and BCC models of DEA. There were seven efficient carriers in the DEA-CCR model and 12 carriers in the DEA-BCC model, up five. The five additional shippers in the BCC model were found to be in a disadvantageous situation due to size, although the BCC value was 1 and the magnitude efficiency value was less than 1. The
Kang and Lee(2019) studies analyzed management efficiency by DEA among the top 15 carriers with superior operating profit among logistics certification carriers in 2018. As a result of the analysis, the scale improvement strategy is presented based on the scale efficiency indicator and the project value of the inefficient company and the reference set that can be benchmarked, suggesting implications for the management improvement plan.
4. Research Methodology and Analysis
4.1 Research Model and Variables
This study was intended to achieve the purpose of the study by the following research procedures.Therefore, the following research models were constructed to achieve this purpose.
Fig.┬Ā1
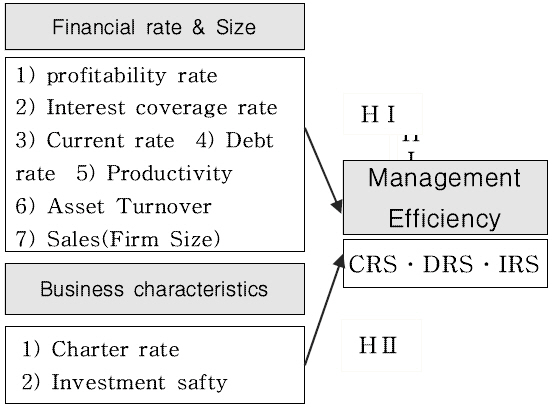
First, the DEA-BCC model resulted in the management efficiency coefficient (CRS = constant return to scale. VRS= variable return to scale. SE = scale efficiency) of ocean carriers. Second, the efficiency coefficient and its relevance to the ocean Carrier's profitability, financial stability, liquidity, asset efficiency, productivity and the size of the entity were tested (assuming I). Third, the effect relationship (Container, bulk, tanker, gas and other ships) of efficiency (Container, Bulk, Tanker, Gas, etc.) and management style (Confidentiality II) was analyzed. In addition, the adequacy of the efficiency and inefficiency classification of ocean carriers of input and output variables was tested.
[HŌģĀ] Financial rate and firm size will affect Korean ocean shipping firmŌĆÖs management efficiency.
[HŌģĀ-1] profitability rate will affect efficiency.
[HŌģĀ-2] Interest coverage rate will affect efficiency.
[HŌģĀ-3] Current rate will affect efficiency.
[HŌģĀ-4] Debt rate will affect efficiency.
[HŌģĀ-5] Productivity will affect efficiency.
[HŌģĀ-6] Asset Turnover will affect efficiency.
[HŌģĀ-7] Sales(Firm Size) will affect efficiency.
Hypothesis II was established as follows by testing the business characteristics to Korean ocean shipping firmŌĆÖs management efficiency.
[HŌģĪ] Business characteristics will affect Korean ocean shipping firmŌĆÖs management efficiency.
[HŌģĪ-1] charter expense will affect efficiency.
[HŌģĪ-2] Investment Safty will affect efficiency.
4.1.1 Dependent variables(Efficiency, CRS)
The dependent variables of this study is the efficiency coefficient (CRS) calculated by the BCC-O model of the DEA. CRS is the efficiency factor when the size of revenue is constant, VRS is the efficiency factor when the size of the revenue is variable, and SE is the efficiency factor of the pure scale. The measurement period is for 2018 from 2016 and is calculated on 116 ocean carriers whose financial statement data are present for three consecutive years. Before tax income to sales raio
4.1.2 Independent variables
(1) Before tax income to sales raio: A typical measure of revenue profitability divided by sales of income tax reduction gains and losses. Management efficiency and profitability are expected to have a positive relationship.
(2) Interest coverage rate: The interest coverage rate used in this study utilized two concepts: operating profit/loss/interest and operating cash/interest. The ocean carriers has high financial risk because of its high debt rate, and the higher the interest coverage rate, the lower the financial risk and the better the management efficiency. Therefore, management efficiency and interest coverage rates are expected to have a positive relationship.
(3) Net working capital/Sales: A representative metric of short-term liquidity is the rate of flow and the rate of net working capital/Sales. In this study, this index was chosen as an influence factor for measuring short-term liquidity of a ocean carrier rather than a current rate in order to properly control the coherence and scale effect among variables. It is a common empirical analysis that liquidity and measurement indicators and debt-to-equity rates are negative relationships because they are inversely related to investments in non-current assets to secure liquidity and profitability. Therefore, it is expected that the net working capital/sales and management efficiency will have a positive relationship in this study.
(4) Borrowings/Sales: In this study, the rate was calculated as short- and long-term borrowings, corporate bond issues and long-term unpaid payments by the BBC. This is because the amount is the main liability that causes financial costs in relation to ships. Therefore, the rate and management efficiency are expected to be related to wealth.
(5) Value added rate: In this study, value added rate is an indicator that divides the value added of ocean carriers by sales, and is a typical productivity index. The largest share of the value-added details are profit and labor expenses, and the interest paid, rent and depreciation costs. These items were selected as independent variables as they are expected to be related to management efficiency and positive(+) because the weight of these items is particularly high for ocean carrier.
(6) Total asset turnover: The total asset turnover rate is a representative activity index that measures how efficiently the total assets held have been utilized to generate revenue. To cope with the protracted global economic downturn and the growing trend of greenhouse gas regulations, carriers are keen to expand their ships and build green ships. Such an asset investment was selected as an independent variable because it was expected that its effective contribution to sales would affect management efficiency. There is expected to be a link between management efficiency and Chung.
(7) Size variable: The size of an enterprise is a variable that is representative of management efficiency. In particular, because of the wide difference in size between ocean carriers, the size was selected as an independent variable to properly control. Generally, size measurement is either total assets or sales, but this study measured the natural logarithm of sales per year, and it is expected that management efficiency will be related to a positive2).
(8) Investment stability: Investment stability is the rate of total operating cash flows divided by management assets and is a typical cash flow measurement indicator. Because most of the management assets of carriers are ships and the main achievements are to generate profits and cash flows from them, the higher the investment stability, the lower the debt-to-equity rate, and thus the independent variable was chosen.
(9) Charter rate(=Charter expense/sale): One of the important decisions of the ocean carriers is the decision of the chartering. The shipping market is booming, but when there is a shortage of ships, Chartering will be implemented to generate shipping revenues. In addition to securing cargoes, it is also used to improve cash flows. These decisions are the main operational and financial decisions of the ocean carriers. Because it requires a huge input of funds in the mid- to long-term, it was selected as an independent variable because it is expected that there will be a positive(+) relationship with the debt rate and negative(-) relationship with management efficiency.
4.2 Analysis Procedure and Method
In this study, the following analysis procedures were performed to derive optimal DEA analysis results. First, the efficiency coefficient was calculated using six models mainly for input/output variables used in the preceding study, and the model compatibility (R2) was chosen between the efficiency coefficient and the input/output variables. Second, panel-probit and panel-logit analysis were performed to verify the adequacy of input and output variables for efficient (CRS) and inefficient (IRS and DRS) distinctions derived by the model VI. Third, the purpose of the study was to test the hypothesis by testing the effect relationship between the efficiency coefficient (CRS) derived from the model VI and the 9 independent variables presented in the research model by the Panel Multivariate Regression. The data used in this study are a combination of cross section data and time series data, with the seven types of financial rates and two outgoing carrier characteristics that affect the CRS (CRS) calculated from the DEA BCC-o model over three years from 2016 to 2018. Therefore, panel multivariate registry was used without the usual multivariate regression to test the causal relationship of the cross section data. Analysis models for panel regression are as follows.
CRSi = DEA co-efficient (i = 116 ocean carriers)
Xi = Financial rate(Before tax income to sales raio, Interest coverage rate, Net working capital/Sales, Borrowings/Sales, Value added rate, Total asset turnover, Size variable(lnsales), Zi=Business characteristics(Investment stability, Charter expense/Sales)
Panel regression is a basic model, with a Ordinary Least Square model(OLS) and a dummy Ordinary Least Square model (OLS_dum) that treats a year or a ocean carrier as an object and then treats it as a entity to control the effects of objects. However, It is common to analyze the fixed effect model, which only analyzes the effects that depend on time trends, separately from the random effect model that analyzes when there is a correlation between objects.. In this study, these four models were analyzed and the model analysis results with high fitness tested the research hypotheses.
5. Empirical analysis results
5.1 DEA Analysis Model and Analysis Results
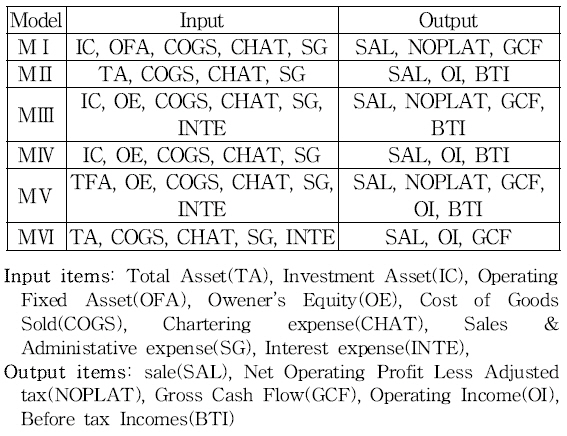
The efficiency coefficient was calculated for each model by constructing six DEA models, focusing on input and output variables used in the preceding study. In addition, the model VI with the highest model fitness(R2) was chosen for regression analysis between the efficiency factor (CRS) and the input and output variables.
Table┬Ā6
Input and Output variable of DEA MODEL
The relevant analysis uses the panel multivariate regression model, and the analysis model is (
1).
CRSi = DEA co-efficient (i = 116 ocean carriers)
Xi=input variables(TA, IC, OFA, OE, COGS, CHAT, SG, INTE), Zi=output variables(SAL, NOPLAT, GCF, OI, BTI),
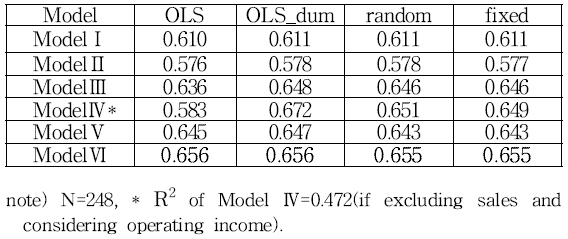
The appropriate model for Table
7 is ModelVI. The DEA analysis results and panel regression analysis results by this model are summarized in Table
8 and Table
9.
Table┬Ā7
R2 of Panel Analysis Model
Table┬Ā8
Regression Result of Input┬ĘOutput by ModelŌģŻ
Table┬Ā9
DEA Analysis Result by ModelŌģŻ
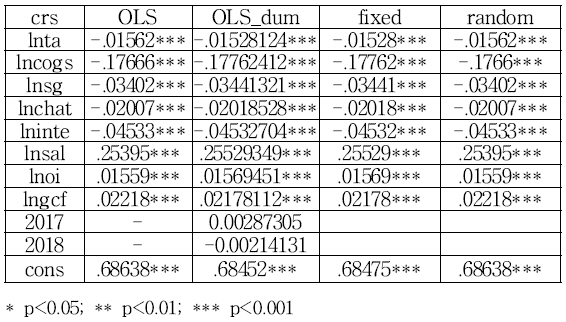
According to Table
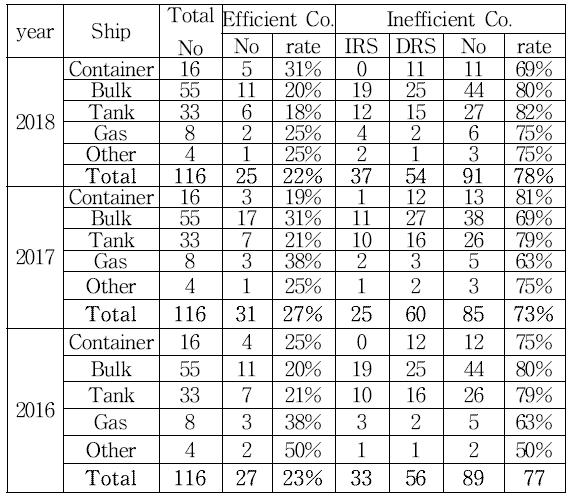
8, all five inputs and three outputs show significant relevance to the efficiency co-efficient (CRS) below the significant level of 0.0001. Input variables are related to negative (-) and output variables are related to positive (+). The smaller the input variables, the larger the output variables, the more efficient the analysis results. Table
9 is the result of DEA analysis by Model IV.. Twenty-five carriers(22%) of all carriers were efficient (CRS) and 91 carriers(78%) were inefficient in 2018. Of these, 37 are IRS carriers and 54 are DRS carriers By type, five(CRS) carriers are efficient and 11(IRS and DRS) are inefficient. The bulk carrier has 11 efficient carriers(CRS), which is 25 % of inefficient ones(44), and the tanker ship has only 6 out of 33 carriers that are efficient. Only two gas vessels, or 25 % of the eight, are efficient carriers. Therefore, management efficiency is low depending on the size of the ocean carriers.
By year, 27 and 25 carriers were efficient in 2016 and 2018, but 31 were the most efficient. In 2017, compared to 2016, one less efficient carriers was found to have sold containers, but six more bulk carriers and one less. The number of inefficient carriers also declined from 89 to 85 in 2016 before rising again to 91 in 2018, worsening the management efficiency of ocean carriers.
5.2 Panel Multivariate Regression Analysis and Hypothesis Test
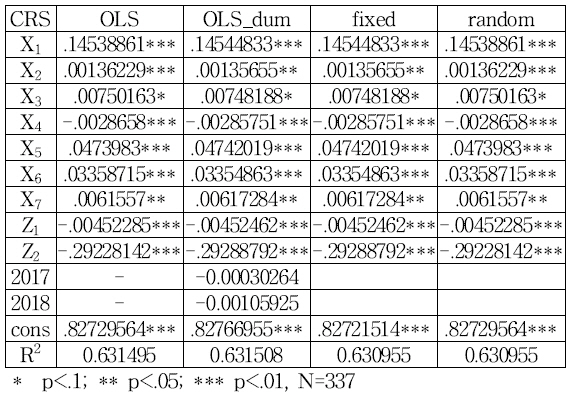
The results of the panel multivariate regression analysis between the DEA Efficiency co-efficient(CRS) and the nine independent variables are as follows. The R2 of the OLS_dum model is the largest. Therefore, if the hypothesis is tested by this model, the following. Before tax income to sales raio(X1) and interest coverage(X2), net working capital/sales(X3), value added rate(X5), total asset turnover (X6) and the size variable(X7) have significant positive effects on management efficiency. Thus, [hypothesis I-1], [hypothesis I-2], [hypothesis I-3], [hypothesis I-5], [hypothesis I-6] and [hypothesis I-7] were all adopted. The debt-to-equity rate, Borrowing/Sales(X4), has significant negative influence on management efficiency, and [hypothesis I-4] was also adopted.In addition, [hypothesis II-1] and [hypothesis II-2] were also adopted, as both investment stability(Z1) and Charter expense/sale(Z2) showed significant negative effects on management efficiency.
Table┬Ā10
Regression Result of CRS┬ĘIndependent Variable
5. Summary and Conclusion
In summary, the results of this study are as follows.
First, for DEA analysis to be appropriate, input and output variables must be fittable. The inputs to the optimal model are total assets, cogs, charter expense, sales and general administrative expense, and interest. The output variables appear to be adequate for sales, operating income, and operating cash flows.
Second, according to the analysis of the 2018 DEA by the above inputs and outputs, 37 (IRS) carriers (32%) need to be increased due to the small size of the 116 ocean carriers under analysis. There are 54 carriers (DRSs) that are too large to be reduced (46%). Thus, 91 (78 %) are inefficient, and 25 (22 %) are efficient, and Korea's ocean carriers are considered insufficient in management efficiency. Except for other ship with small numbers, gas carriers have the highest efficient rate of 38 % in 2016 and 2017. Tanker ships are the lowest with 21 % in 2016 and 19 % in 2017 with the lowest efficient rate. However, container carriers have the highest efficiency rate of 31 % in 2018, showing signs of gradual improvement in the size of container carriers.
Third, the results of the test for relevance between the DEA Efficiency(CRS) coefficients and the financial rate and the characteristic variables by the panel multivariate regression are as follows. The biggest negative influence on efficiency (CRS) is the Charter expense/sale(Z2), which proves that the larger the Charter expense size, the less efficient the ship's management The next major variable is the profitability index, the before tax income to sales raio, which has a positive impact, so the more profitable the ship is, the more efficient the management is. The next significant influence variable of the positive is the value added rate, which is the productivity index, and the total asset turnover rate, which is the asset efficiency index. Therefore, the higher the productivity and asset turnover, the better the management efficiency is shown. Meanwhile, the debt-to-equity rate, borrowings/sales, has a significant negative impact on management efficiency that is very strong, indicating that the higher the borrowing rate, the worse not only financial risk but also management efficiency. In addition, the scale variable and interest coverage rate, below the significant level of 5%, also have a positive (+) effect on management efficiency. Therefore, the larger the ocean carrier and the better the interest coverage rate, the better the shipper's management efficiency is shown. In other words, the ocean carrier need to make efforts to increase sales profitability and productivity by securing stable cargoes and managing expenses. In addition, efforts to enhance the efficiency of total assets are also needed by carrying out efficient fleet management and route management. Through these efforts, it appears that global competitiveness can be restored only when management efficiency is improved.
The implications of these findings are just the results of the last three years. Therefore, it is necessary to expand and analyze data before and after the financial crisis, but failing to do so due to the constraints of data collection is the limitation of this study. Also, the limitations of this study are the inability to compare problems in management of ocean carriers in Korea compared to global shipping carriers or competitors in China, Japan and Taiwan. This is a future research project.


 PDF Links
 PubReader
 Full text via DOI
 Download Citation
 Print
Print