해양 석유 생산 및 수송 최적화 문제에 관한 연구
A Study on the Optimization Problem for Offshore Oil Production and Transportation
Article information
Abstract
해양 석유 생산은 ‘해양‘이라는 특성에 기인하는 여러 가지 변수를 동반하면서 막대한 비용과 시간을 필요로 한다. 모든 관련된 프 로세스는 인명, 환경 그리고 재산의 손실을 줄이기 위한 치밀한 일련의 계획에 의하여 통제된다. 이 논문은 해양 석유 생산 및 수송의 최적화 문제를 다룬다. 문제 영역의 범위를 정의하기 위해 해양 석유 생산 및 수송 네트워크를 제시하고 그 문제를 해결하기 위한 혼합정수계획모형 을 구축하였다. 제안된 최적화 모형의 타당성을 확인하기 위해 가상의 해양 유전과 수요 시장을 바탕으로 MS Office Excel의 해찾기를 이용 하여 계산실험들을 수행하였다. 해양 석유 생산 및 수송 네트워크 하위 흐름은 해양 유전에서 생산된 원유를 수요 시장으로 배분하는 해사수 송문제가 된다. 이 해사수송문제를 해결하기 위해 집합 패킹 모형을 이용하여 구축된 MoDiSS(Model-based DSS in Ship Scheduling)를 사 용하였다. 이러한 연구결과들은 실제적인 해양 석유 생산 및 수송 최적화 문제에 의미 있게 적용될 수 있으리라 사료된다.
Trans Abstract
The offshore oil production requires a huge amount of cost and time accompanied by multiple variables due to the peculiar nature of ‘offshore’. And every process concerned is controlled by elaborate series of plans for reducing loss of lives, environment and property. This paper treats an optimization problem for offshore oil production and transportation. We present an offshore production and transportation network to define scope of the problem and construct a mixed integer linear programming model to tackle it. To demonstrate the validity of the optimization model presented, some computational experiments based on hypothetical offshore oil fields and demand markets are carried out by using MS Office Excel solver. The downstream of the offshore production and transportation network ends up with the maritime transportation problem distributing the crude oil produced from offshore fields to demand markets. We used MoDiSS(Model-based DSS in Ship Scheduling) which was built to resolve this maritime transportation problem. The paper concludes with the remark that the results of the study might be meaningfully applicable to the real world problems of offshore oil production and transportation.
1. 서 론
‘Offshore’라는 단어는 여러 의미를 가지고 있는데, 지정학 적인 표현일 경우에는 말 그대로 ‘Onshore’의 반대 의미로써 ‘육안(shore)과 떨어진(off)’ 즉 ‘해양’이라는 의미를 담고 있다. 특히 ‘Offshore’가 석유 및 가스 산업과 관련하여 쓰일 때는 육 안에서 떨어진 해양에서 이루어지는 모든 석유 및 가스 관련 산업을 통칭하는 의미로 쓰인다.
해양 석유 생산은 ‘해양’이라는 장소적 특성으로 인한 해양 기상, 해저환경, 해양플랜트의 기술적 요소, 해사수송 문제 이 외에도 글로벌 에너지 수급에 영향을 미치는 정치 경제적 요 인 등 여러 가지 변수에 의한 제약을 받는다. 또한 장기적으로 거대한 자본이 소요되는 산업이기에 자본력이 막강한 다국적 석유회사(International Oil Company, IOC)나 국영석유회사 (National Oil Company, NOC)의 주도하에 진행된다.
해양 석유 생산은 크게 탐사(Exploration), 시추(Drilling), 그 리고 생산(Production)이라는 3가지 절차를 거치는데, 추후 해 양 유전의 석유 자원이 고갈된 후에는 해체(Decommissioning) 절차를 밟게 된다.
해양 석유 생산은 1970년대 말 들어 육상 석유 생산 대비 그 비중이 증가하였다. 또한 2000년대부터는 수심 4,000 feet 이상의 심해 석유 생산의 비중이 꾸준히 증가하여 2013년에는 9%에 달하였으며, 이미 2009년 무렵에 심해 시추가 천해 시추 보다 늘어난 것1)으로 미루어 해양 석유 생산, 특히 심해 석유 생산이 증가하는 추세는 앞으로도 지속될 것으로 전망된다.
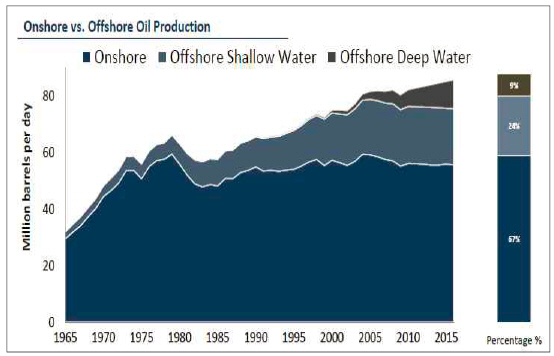
Onshore vs. Offshore Oil Production (Infield system, 2013)
해양에서 생산된 석유를 수송하는 방법에는 해저 파이프 라인을 통하여 수요지까지 보내는 방법과 FPSO(Floating production storage and offloading) 또는 SPM(Single Point Mooring)을 통해 탱커로 하역을 한 후 수요지까지 해상운송 (Maritime transportation)을 하는 방법이 있다. 2014년 현재, 가 장 긴 해저 파이프라인은 2012년 러시아의 바이보르그 (Vyborg)와 독일의 그레이프츠발드(Greifswald)사이에 건설된 1,222 Km길이의 노르드 스트림(Nord Stream) 천연가스 파이 프라인이다. 이 프로젝트에 88억 Euro가 들었음이 시사하듯 이 해저 파이프라인 건설에는 많은 비용이 발생하고 운송 목 적지의 선택이 지극히 제한적이기 때문에 해양에서 생산된 석유와 가스는 대부분 해상운송을 통하여 수송하고 있다.
본 논문은 가상의 해양 유전과 이에서 생산된 원유의 수 요지들을 설정하여 다국적 석유회사 혹은 국영석유회사들이 직면하는 해양 석유 생산과 수송의 최적화 문제를 연구대상 으로 한다.
2. 선행연구
해양 석유 생산의 최적화 문제는 해양 석유 생산 기술이 비교적 안정권에 들어선 1970년대의 유럽에서 처음 연구되기 시작하였다. 해양 유전의 탐사, 개발, 시추, 생산 등의 전반적 인 과정에 있어 경영과학적 접근이 도입되었고 이는 차츰 다 른 지역의 신규 해양 유전을 개발하는 데에 유용하게 사용될 수 있는 지침으로 활용되기 시작하였다. Bohannon(1970)은 유 전의 설계와 생산계획에 혼합정수선형계획의 사용을 제안하 였고, Flare(1973)는 시간 배분에 따른 유정(well)의 배치와 생 산시설의 운영일정의 최적화 모형을 발표하였다. 이후 Iyer et al.(1998)이 해양 시설의 계획, 투자, 운영에 관한 다기간 (multi-period) 혼합정수선형계획 모형을 발표하였다. Ortiz-Gomez et al.(2002)은 시간대별 석유 생산의 지속과 중단 에 대한 의사결정에 다기간 혼합정수선형계획을 도입한 모형 을 발표하였으며 Lin & Floudas(2003)는 유정 플랫폼(well platform)계획 문제에 지속시간 모델링과 최적화 설계를 도입 한 연구결과를 발표하였다. Richard J. Barnes et al.(2007)은 해 양 유전이 개발되고 운용되는 전체 기간 동안에 최소한의 비 용을 유지하기 위하여 유정 시추점(well centre)을 정하고 최적 화된 시추와 생산계획을 세우는 데에 수학적인 모형을 이용한 접근법을 연구하였다. 이 논문은 Richard J. Barnes et al.(2007) 이 제안한 최적화 모형과는 달리 예측된 시장의 수요를 만족 시키면서 기업의 이익을 최대화하는 새로운 모형을 제안하고 자 한다.
한편으로 해양에서의 수송문제는 화물의 선적지가 항만이 아닌 해양 유전이며 FPSO나 SPM를 통하여 화물을 선적한다 는 일부 특성을 제외한다면, 서로 다른 선적지에서 화물을 선 적하여 서로 다른 하역지로 수송한다는 점에서 전형적인 해사 수송 문제라고 할 수 있으며, 이중에서도 화물의 특성상 유조 선대의 운영 최적화 문제와 동일하다[Kim & Heo(1999)]. 이러 한 해사수송 문제에 대하여 Appelgren(1969 and 1971)은 기존 의 연구들과는 다르게 집합 분할(Set Partitioning) 또는 집합 패 킹(Set Packing)모형으로 정식화하였는데, 선박이 운항 가능한 일정에 투입되는지의 여부를 0-1 정수변수로 정의하는 방식으 로 문제를 해결하였다. 이를 계기로 이후의 부정기선 또는 화 주 직접운항 형태의 선박 운항일정계획 최적화 모형은 거의 모두가 집합 분할 또는 집합 패킹모형의 형태를 취하고 있다 (Lee & Kim, 1994). Kim(1999)은 부정기선 운항 문제의 핵심이 되는 선박운항일정계획 문제를 일반화하여 정의하고 그 최적 화 모형을 집합패킹모형으로 제안한 최적화 모형 기반의 시스 템인 MoDiSS(Model based Decision Support System in Ship Scheduling, 선박운항일정 의사결정 지원시스템)를 구축하였다. 이 연구에서는 해양 유전에서 생산된 석유를 수요시장으로 수 송하는 문제의 최적화를 위해 MoDiSS를 사용하고자 한다.
3. 문제의 개요 및 정식화
해양석유의 생산 및 수송 문제는 다국적 석유기업이 점유 시장의 수요를 만족시키면서 기업의 이익을 극대화하는 최적 화 문제로 설명할 수 있다. 이 논문은 해양 유전에서 석유를 생산하고 이를 시장에 수송하는 문제를 Fig. 2와 같이 하나의 물류 네트워크로 표현하여 이 해양석유 생산 및 수송 네트워 크를 최적화하고자 한다.
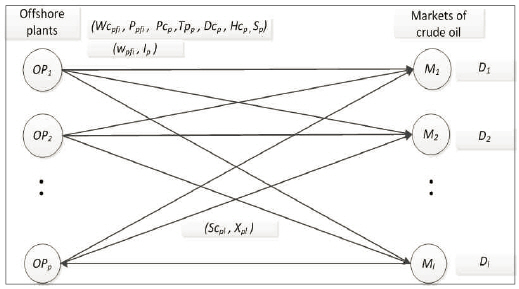
Offshore production-transportation network
해양석유 생산 및 수송 네트워크를 최적화하는 문제는 다음과 같이 혼합정수계획모형으로 정식화할 수 있다.
[Data]
Wcpfi : Well cost of well i in the field f of OP(Offshore Plant) p ($US)
Ppfi : Productivity of well i in the field f of OP p (Thousand bbls)
Pcp : Crude oil price of OP p ($US/Thousand bbls)
Scpl : Shipping cost of crude oil from OP p to local market l ($US/Thousand bbls)
Dl : Demand of local market l (Thousand bbls)
Hcp : Holding cost of crude oil storage of OP p ($US/Thousand bbls/day)
Tpp : Target Production of OP p (Thousand bbls)
Dcp : Design capacity of OP p (Thousand bbls)
Sp : Storage capacity of OP p (Thousand bbls)
[Decision Variables]
wpfi : The binary variable to select well i of the field f in OP p
Xpl : Quantity of crude oil shipped from OP p to local market l(Thousand bbls)
Ip : The amount of inventory storage in OP p(Thousand bbls)
Formulation [MILP1]
s.t.
모형 [MILP1]의 식 (1)은 생산된 해양석유의 판매수익에서 유정생산비용, 수송비용 및 재고비용을 감한 목적함수를 최대 화한다는 것이다. 제약식 (2)는 해양플랜트에서 생산하는 해양 석유의 양이 각 플랜트의 목표생산량 이상이어야 한다는 것이 며, 제약식 (3)은 각 해양플랜트의 해양석유 생산량이 해당 플 랜트의 설계용량을 초과할 수 없다는 것이다. 제약식 (4)는 해 양플랜트의 해양석유 총 생산량이 수요 시장의 수요를 만족하 여야 한다는 것이고, 제약식 (5)는 각 플랜트의 재고량이 그 플랜트의 저장용량을 초과할 수 없다는 것이며, 제약식 (6)은 각 해양플랜트의 해양석유 생산량에서 수요시장으로 수송하 고 남은 것이 그 플랜트의 재고량이 된다는 균형제약식이다. 마지막으로 식 (7)은 이진변수 및 비음제약에 관한 식이다. 모형 [MILP1]의 최적해가 구해지면 각 해양플랜트에서 생산된 원유를 각 시장의 수요를 만족시키도록 수송하여야 한다. 이러 한 하위 흐름의 해사수송문제를 해결하기 위하여 집합패킹모형 을 기반으로 구축된 MoDiSS를 이용한다.
4. 계산실험
계산실험은 크게 2가지로 나뉘는데, 하나는 MS Office Excel의 해찾기를 통한 모형 [MILP1]의 최적화이고 다른 하나 는 MoDiSS 프로그램을 사용한 해사수송 문제의 최적화이다. 해양 석유 생산의 최적화문제는 시장의 수요가 많을 때와 적 을 때의 두 가지 상황으로 나누어 실험하여 그 결과를 비교하 고자 한다.
본 논문에서는 West Africa, Gulf of Mexico, 그리고 Middle East에 석유를 생산하는 해양 플랜트를 보유하고 있는 가상의 다국적 석유기업을 구상하였으며, 각 해양 플랜트의 상세는 Table 1과 같다.

Hypothetical Offshore fields
4.1 해양 석유 생산의 최적화
상기 해양 플랜트에서 생산된 원유의 수요지는 Europe, North America 그리고 Far East로 설정하였으며, 계산실험에 사 용된 각 수요지의 수요량은 Table 2와 같다. 낮은 시장 수요는 높은 시장 수요의 75%로 설정하였다.

Demand of local market (Unit: 1000 bbls)
각 유정의 목표 생산량은 Table 3과 같다. 낮은 시장 수요 일 때는 목표 생산량을 높은 시장 수요의 85% 수준으로 설정 하였다.

target production of offshore plant (Unit: 1000 bbls)
Fig. 3은 높은 시장 수요일 경우의 해양 석유 생산의 최적해 결과이며, Fig. 4는 이때 각 생산 유정의 가동 여부를 나타낸다. 검은색 글씨가 가동(1)을 의미하며, 붉은 색 글씨는 미가동(0) 을 의미한다.
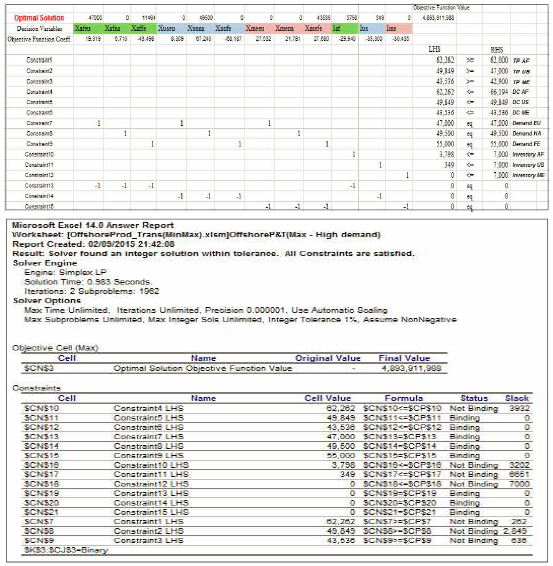
Offshore production optimization (high market demand)
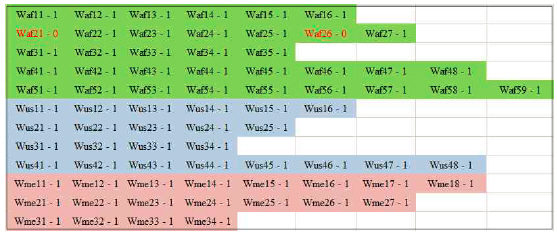
Well selection(high market demand)
높은 시장 수요일 경우에, 시장 수요를 충족시키기 위하여 West africa의 2개를 제외한 모든 생산 유정을 가동하였다. 원 유의 수송은 West Africa에서 Europe으로 47,000,000 배럴, Far East로 11,464,000 배럴, Gulf of Mexico에서 North America로 49,500,000 배럴 그리고 Middle East에서 Far East로 43,536,000 배럴이다. 재고는 West Africa에서 3,798,000 배럴, Gulf of Mexico에서 349,000 배럴이 발생하였다. 생산-수송된 원유가격 에서 유정의 단위생산 비용과 수송비 그리고, 재고비용을 제 한 순수익은 4,893,911,988 US$이다.
다음은 낮은 시장 수요일 경우의 계산실험 결과이다. Fig. 5는 낮은 시장 수요일 경우의 해양 석유 생산의 최적화 실험 결과이며, Fig. 6는 이때 각 생산 유정의 가동 여부를 나타낸 다.

Offshore production optimization (low market demand)
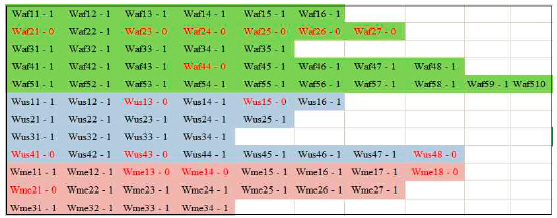
Well selection(low market demand)
낮은 시장 수요일 경우에는 시장 수요가 감소하였기 때문 에 생산량을 줄이기 위하여 West africa의 7개, Gulf of Mexico 의 5개 그리고, Middle East의 4개의 생산 유정의 가동이 중지 되었다. 원유의 수송은 West Africa에서 Europe으로 35,250,000 배럴, North America로 3,410,000 배럴, Far East로 7,251,000 배 럴, Gulf of Mexico에서 North America로 33,715,000 배럴 그리 고 Middle East에서 Far East로 33,999,000 배럴이다. 재고는 West Africa에서 7,000,000 배럴, Gulf of Mexico에서 7,000,000 배럴 그리고, Middle East에서 2,509,000 배럴이 발생하였다. 생산-수송된 원유가격에서 유정의 단위생산 비용과 수송비 그 리고, 재고비용을 제한 순수익은 3,417,600,415 US$이다.
해양 석유 생산의 최적화 설계에는 다국적 석유기업의 시 장 수요에 따른 시장점유율(market share) 상황을 고려한 시장 수요, 각 플랜트의 저유능력 및 재고비용 등이 매우 중요한 영 향을 미친다고 볼 수 있다.
4.2 해양 석유 수송의 최적화
본 절에서는 위의 두 실험결과들 중 낮은 시장 수요일 경 우의 수송 문제를 다룬다. 다국적 석유기업을 자신의 화물을 보다 경제적, 안정적으로 적시에 수송하기 위한 목적으로 30 척의 자사 소유의 280,000 ~ 300,000 DWT급 VLCC 선대를 보 유한 화주 직접운항 선사(industrial carrier)로 가정하여 해양 플 랜트에서 생산된 석유를 수요지까지 수송하는 문제를 주어진 선박, 화물, 항구간 거리에 대한 정보로 수익을 극대화 할 수 있는 최적의 선대 운항일정을 도출해주는 MoDiSS 프로그램을 사용하여 그 최적해를 구한다.
MoDiSS 프로그램의 입력자료는 Table 4와 같은 자사 선대 의 선박 자료, Table 5와 같은 수송 화물 자료, 그리고 각 선적 항과 하역항간의 거리가 필요하다. Table 5와 같은 수송 화물 자료는 4.1절에서 낮은 시장 수요일 경우의 해양 석유 생산의 최적화 계산실험 결과를 바탕으로, 각 플랜트의 일일 생산량 과 저유시설의 규모, 운항 가능한 탱커들의 수송화물 용적을 고려하여, 다국적 석유기업의 1 분기(90일)간의 원유의 수송계 획을 화물 60개로 나누어 수립한 것이다.

Ship data

Cargo data
Table 6은 loading port와 discharging port간의 거리와 소요 시간이다. 소요시간(Time)은 탱커가 11.0 Knot로 항해하였다고 가정하여 계산하였다.

Distance table between loading and discharging ports
Fig. 7은 위의 선박, 화물, 거리 정보를 바탕으로 도출된 최 적의 선대 운항일정을 나타내는 MoDiSS 프로그램 화면이다.
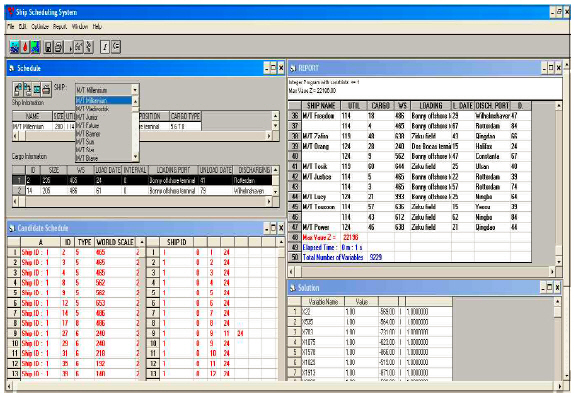
MoDiSS showing optimal schedule using own tanker fleet
Table 7은 위의 실험을 통하여 도출된 선대 최적운항일정의 상세이다.

Optimal schedule by using own tanker fleet
위의 결과에서 보듯이 자사 선단만으로는 30척이 모두 운항 일정에 투입되었음에도 불구하고 60개의 수송수요 중 47개만을 충족하는 결과가 나왔다. 이는 30척의 자사선단으로는 다국적 석유기업의 당해 분기 동안의 수송수요를 충족시키는 것이 불 가능하다는 것을 의미한다. 따라서 다국적 석유기업은 나머지 13개의 수송화물들도 수요지까지 안정적으로 수송하기 위하여 Table 8과 같이 선박의 크기와 초기위치(initial position) 등을 고려하여 용선시장(spot market)의 탱커를 추가로 입력하여 계 산실험을 할 수 있다.

Ship data (Chartered tanker fleet)
Table 9는 위의 실험을 통하여 도출된 선대 최적운항일정의 상세이다.

Optimal schedule by using own tanker fleet and chartered fleet.
위의 결과에서 보듯이 다국적 석유기업은 30척의 자사 선 단과 10척의 용선 선박으로 60개의 수송수요를 모두 만족시키 는 최적 운항일정계획을 수립하였으며, 이는 제 4.1절에서 다 룬 다국적 석유기업의 분기별 원유 생산계획에 이은 분기별 원유 수송계획이 된다.
단기 용선을 하여 운항하는 선박은 자사 선박에 비하여 기 본적으로 더 많은 비용이 소요되며, 용선시장은 운임 변동의 영향을 받기 때문에 다국적 석유기업의 수송수요를 안정적으 로 충족시키기 위한 자사 선단을 보유할 필요가 있다. 이러한 사항들을 고려하여 적정 규모의 자사선단을 보유하고 자사 선 단만으로는 수송수요의 충족이 불가능한 경우에 적절한 용선 선박을 들여와 운항계획에 투입하는 의사결정은 매우 중요하 며, 위와 같은 최적 운항일정계획을 목적으로 한 실험이 그러 한 의사결정을 지원할 수 있다.
5. 결 론
육상의 자원은 점점 고갈되어가고 있는데 비해 해양에서 생산하는 석유 및 가스는 2014년 현재 이미 전 세계 석유 및 가스 생산량의 1/3을 차지하고 있고, 탐사, 시추, 그리고 생산 기술의 지속적인 발전으로 보다 심해로 개발영역이 확장되고 있어 그 비중은 더욱 커질 전망이다. 하지만, 해양에서의 석유 및 가스 생산은 육상 생산보다 많은 시간과 자본이 소요되며 개발과정중의 실패, 환경오염, 인명사고 등 상당한 위험성을 내포하고 있는 산업이기에 인명과 환경, 자산의 안전을 보장 하는 범위 안에서 생산과 수송에 소요되는 시간과 비용을 효 율적으로 계획하여 수익을 극대화 시키는 최적화된 의사결정 모델의 수립이 필수이다.
본 논문에서 다룬 해양 석유 생산 문제는 혼합정수계획모 형을 이용하면, 각 해양 플랜트의 석유 생산 가능량과 시장수 요가 주어졌을 경우에 생산에 필요한 유정의 선택, 수요시장 으로의 해사수송, 그리고 해양플랜트에서의 원유의 재고처리 문제에 대한 최적화된 의사결정이 가능하다. 또한 시장 수요 가 많을 경우에는 생산량을 늘려 수요를 최대한 충족시켜 이 윤을 극대화시키며, 수요가 적을 경우에는 생산량을 줄여 생 산비용과 재고비용 등을 최소화하여 손실을 줄일 수 있는 합 리적인 의사결정의 수립도 가능하다.
또한 다국적 석유기업이 보유하고 있는 화주직접 운항선대 (Industrial fleet)로 주어진 수송수요를 충족시킬 수 있을지 아 니면, 추가로 용선시장에서 탱커들을 용선하여 투입하여야 할 것인지에 대한 의사결정도 지원할 수 있음을 알 수 있었다.
Notes
Global Offshore Prospects 2013, Douglas Westwood