1. Introduction
1.1 Background
Globally the climate change is perceived as a very important issue that can be no longer avoided. Among them, most of the greenhouse gases that have the greatest impact on global warming are carbon dioxide. Currently, technologies such as the improving efficiency of energy utilization, the development of renewable energies, and the expansion of bio-absorption sources are being implemented for reducing of carbon dioxide. However, those are difficult to meet the greenhouse gas reduction target within a short period and effectively through these methods and there is still a problem of difficulties to cover the increased energy demands. Especially, in Korea under relying on thermal power generation for the supply of energy, it is impossible to replace the existing power generation facilities shortly and this is accepted in the limit of existing technologies. Each country makes effort to grasp a new clean energy source with no emission for long term base and at the same time wants to keep the existing emission level burning traditional fossil fuels. Many nations are developing technologies for capturing of from large point sources such as power plants, heavy industries, transporting the captured to a permanent disposal site without exposing it to the atmosphere to prepare for the coming world climate change. The 40% of emission which is the main part of the greenhouse gas is emitted from a specific point source such as power plant. The world pays attention to the CCS technology for sequestration directly from the massive source, securing, transportation, and storing safely under long term based.
IEA and OECD are expecting that CCS will cover 19% of 48 Billon ton of world reduction amount, which is 9.1 Billion ton of(
IEA, 2010). R&D Investment of foreign government on CCS technology had started at 90ŌĆÖs and driven to commercialization presently. Research groups of UN, Norway, UK, Netherlands, etc. and universities are working together to develop monitoring and modelling technologies for monitoring behavior and sensing leakage. In Korea, Carbon Capture & Sequestration R&D Center (KCRC), established by Ministry of Science and ICT, drives small scale empirical research and projects responding to the national plan for greenhouse gas reduction. Furthermore, supports for technology development under pan-government level to achieve commercialization target such as ŌĆśGovernment R&D `20ŌĆÖ.
1.2 Study Consideration
The atmospheric concentrations due to emissions has resulted in the oceans taking up at a rate of about 7 Giga ton per year. Thus resulted in a decrease of pH of about 0.1 at the ocean surface and mixed with deep ocean water. Eventually, the acidification of seawater destroys the marine ecosystem. This study deals the technology to accelerate the neutralization reaction of and seawater through the lime material neutralization reaction (AWL method;
Kheshgi, 1995) and discharge it to the ocean in the form of bicarbonate ion concentrated water. More than 90% of the carbonate exists as a bicarbonate ion form under seawater pH conditions. This is stable while released into the atmosphere and because of its alkalinity, it is expected to mitigate the acidification of seawater. Water quality parameter adopted in this study is DIC, which is measured as a dissolved inorganic carbon, alkalinity in sea water. Therefore, this study deals with determination of water quality parameter DIC through theoretical study and field data analysis, for ocean water and discusses DIC concentration to be discharged. A numerical model CORMIX, (the Cornell Mixing Zone Expert System) is applied to analyze the behavior of effluent depending on surface discharge and submerged discharge under various scenarios. At the end, investigation on the impact of bicarbonate concentrated water in ocean storage is being introduced.
2. DIC Approach for CCS Method
2.1 Neutralization reaction of Bicarbonate Seawater
As described before, the captured
CO2 from power plants, heavy industries, etc. is injected into the seawater and dissolved with alkaline media to form bicarbonate ion (
HCO3ŌłÆ ) and carbonate ion (
CO32ŌłÆ ). The resulting concentrated water will be discharged, diluted, and stored. For this purpose, the alkaline
CaO is applied to get maximized density of Dissolved Inorganic Carbon (DIC;
CO2 ,
HCO3ŌłÆ ,
CO32ŌłÆ ) through neutral reaction and the excess DIC will be generated by dissolving particles. The neutralization reaction formula (
Lee et al., 2017) may be written as Equation (
1):
More than 90% of the carbonate exists under seawater pH conditions as not
CO2(aq) or
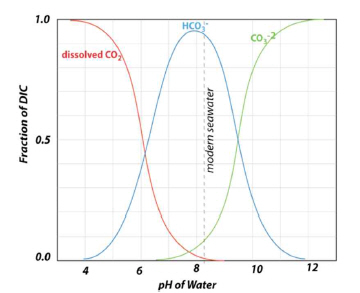
CO32ŌłÆ but a bicarbonate ion form as shown in Fig.
1 (after
Holmen, 1992). Both
CO2 (aq) and
CO32ŌłÆ are relatively small amounts. Bicarbonate ion is a type of DIC. It exists in the form of ion and is stable while released into the atmosphere. Also it release hydroxide ions through an equilibrium reaction in water and reduce hydrogen ion and because of its alkalinity, it is expected to mitigate the acidification of seawater. In this study, DIC adopted for water quality parameter is the sum of
CO2 ,
HCO3ŌłÆ ,
CO32ŌłÆ in order to examine the affects and efficiency in the ocean storage of carbon dioxide which is difficult to proceed in the energy engineering research group.
Fig.┬Ā1
Relationship between carbon species and pH
2.2 Classification of Concentrated Seawater
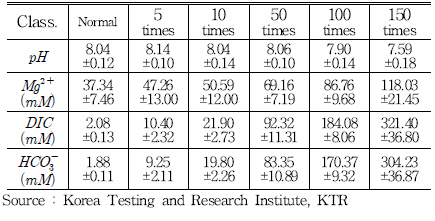
To analyze the behavior of discharged DIC depending on concentrations from the ocean disposal system, five different cases such as 5, 10, 50, 100, 150 times for normal condition were adopted depending on the concentration bicarbonate seawater. Table
1 shows the standard of bicarbonate concentrations of seawater by KTR to be applied to CORMIX model. The concentration of Mg, DIC, in the higher concentrated seawater will be increased but pH be dropped.
Table┬Ā1
Characteristics of bicarbonate seawater according to concentration of bicarbonate
3. Numerical Application
3.1 CORMIX Model
The CORMIX model is based on buoyant jet similarity theory, buoyant jet integral models, ambient diffusion theory, stratified flow theory, and simple dimensional analysis (
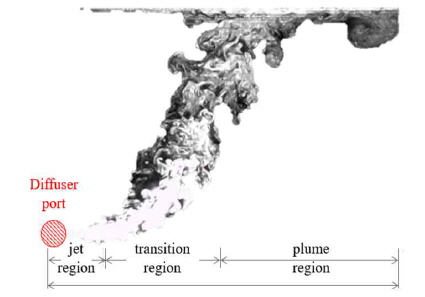
Doneker and Jirka, 1990). It is able to predict flow configurations ranging from internally trapped plumes, buoyant plumes in uniform density layers with or without shallow water instabilities, and sinking (negatively-buoyant) plumes with boundary interaction, upstream intrusion, buoyant spreading, and passive diffusion environment. Design priority for marine discharging plan in this study is 'Maximizing initial dilution of effluentŌĆÖ. To meet this target is to transform the discharged water into turbulent flow pattern at Near Field Region(NFR), where combination of particle motion dominant jet region and buoyancy dominant plume region, including transition region as shown in Fig.
2. By doing this it is possible to increase initial dilution rate from the increase of volumetric flux through entrain of peripheral water. For this reason, it is very important to analyze and investigate the behavior of discharged DIC, especially at NFR. The numerical model adopted here is CORMIX, which is intended to support analysis of dilution characteristics at NFR and environmental impact evaluation from the continuous discharge of point pollutant sources.
Fig.┬Ā2
Schematic of near field zone, NFR
3.2 Selected Sea Area
The worldŌĆÖs oceans represent the largest potential sink for
CO2 in the atmosphere and it is estimated that the ocean already consumes about 7 Giga ton per year. In Korea, the amount of
CO2 production in a year is 150Mega TC (Carbonate ton) and the East sea absorbs 5% of total. This gives 400Mega TC for 200years. Under consideration of this, the selected target area in this study is southern part of Ulleungdo, in the east coast of Korea as shown in Fig.
3, where the capability of
CO2 absorption rate reaches to 80
molC/
m2 (=12g of carbonate) and this is greater than in Pacific(20Ōł╝30
molC/
m2) or Northern Atlantic Ocean (66Ōł╝72
molC/
m2 ).
Fig.┬Ā3
The merits of this site are 1) Continuous marine discharge of bicarbonate ion-enriched water is possible, 2) Dilution and storage of the discharged concentrated water are easy, and 3) Ensure sufficient water depth and providing refuge to the working vessel. Fig.
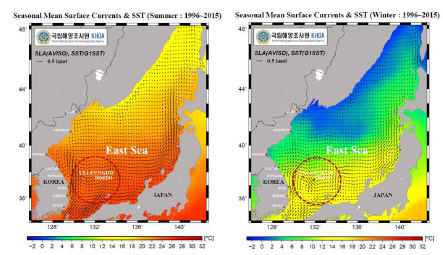
4 shows seasonal surface currents and sea surface temperature.
Fig.┬Ā4
Observed current & sea surface temperature
sources : Korea Hydrographic and Oceanographic Agency
3.3 Characteristics of Model Inputs
Discharge scenario is to be made considering the classified bicarbonate seawater and sea conditions. All physical parameters and variables will be introduced into CORMIX model for prediction of the behavior of DIC.
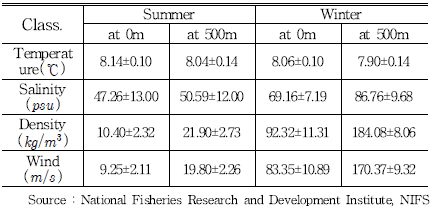
The physical and chemical characteristics of seawater for the study area were summarized at Table
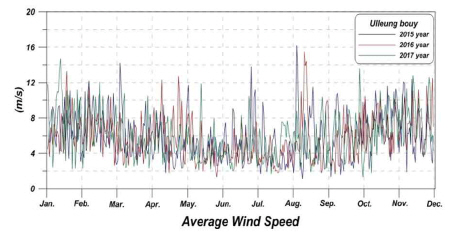
2 from the stationary ocean measurement data (07ŌĆÖ-17ŌĆÖ) of National Fisheries Research and Development Institute (NIFS), and in Fig.
5 for wind data from Ulleung ocean observation buoy (15ŌĆÖ-17ŌĆÖ) of Korea Meteorological Administration(KMA).
Table┬Ā2
Summary of air and seawater conditions at the study area
Fig.┬Ā5
Averaged wind speed(2015-2017) at Ulleung buoy (after
KMA, 2018)
4. Model Scenario
4.1 Discharge Conditions
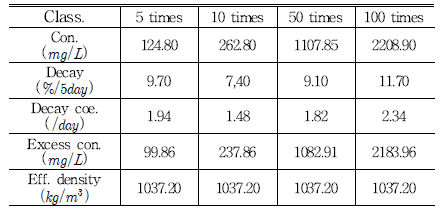
In order to analyze the behavior characteristic of discharged DIC for density stratified seawater, the concentrated DIC was discharged at 10m, 100m, and 300m, respectively for the given 1,000 water depth area under the condition of effluent, ambient water, and discharge method. The decay ratio and decay coefficient are decided by laboratory measurement DIC concentration once per day for 9 days after highly concentrated original DIC source diluted by half with water. It appears that 100 times DIC concentration in seawater was reduced to 50% after 9 days. Table
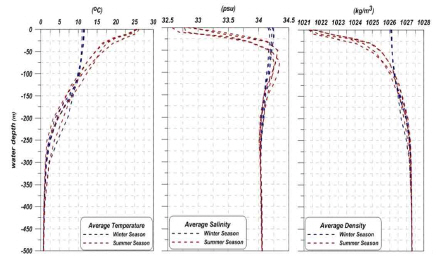
3 shows the stationary ocean measurement data (07ŌĆÖ-17ŌĆÖ) of NIFS and Fig.
6 indicates the vertical profiles of temperature, salinity, and density at the study area.
Table┬Ā3
Conditions of bicarbonate concentrated seawater
Fig.┬Ā6
Vertical profiles of temperature, salinity and density with respect to water depth
A point release of negatively buoyant DIC particles at 3 different depths through the towed pipe from a moving ship (Fig.
7) shows a sinking plume with potential dilution. And also depending on DIC concentration, each case was subdivided by 5 cases as shown at the Table
3. Besides these cases, seasonal variation such as summer and winter, and discharging velocity, also included. Therefore total simulation cases are 60. It is considered a ship traveling at speed us at about 1,000m water depth.
Fig.┬Ā7
Schematic of the towed pipe DIC discharge scenario
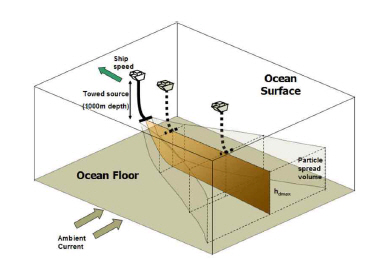
The ship speed was set to us=3m/s (6knots) considering the discharge speed to 0.5m/s and 1.0m/s, which is large enough to prevent a buoyant plume from the highest loading.
4.2 Results and Analysis
The representative experiment for discharging scenario adopts discharging DIC concentration as 150 times enriched. As shown in Fig.
8, the plume moves to the bottom under negative buoyancy motion. Fig.
9
Fig.┬Ā8
3-D mixing visualization of discharge scenario
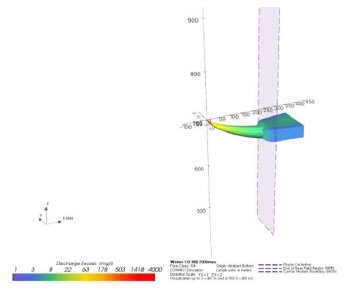
Fig.┬Ā9
Hydrate particle release image from a stationary source in a strong cross flow(after
Chow, 2009)

The representative experiment for discharging scenario adopts discharging DIC concentration as 150 times enriched. As shown in Fig.
8, the plume moves to the bottom under negative buoyancy motion.
The released plume forms axial symmetry in NFR (Near Field Region). After this, stage one shows particles separation and at stage two, the remainder of the original plume contains a single DIC plume. As the density stratification is stable at ambient seawater for surface discharge, the plume seems to be stagnant expanding to ambient seawater. This trend is almost same regardless of season, plume released speed, and DIC concentration. The trend is similar to Fig.
9, which shows a schematic image of the entrained particles separated from the original plume and settled discretely some distance from the plume source in a sufficiently strong current (
Chow et al., 2009).
The excess concentration and dilution rate was analyzed with respect to season, discharge depth, plume released speed, and initial concentrated DIC source. From this it is intended to deduce an optimum DIC discharge method. Fig.
10 through Fig.
17 are showing comparisons of the results from each scenario applied to CORMIX model.
Fig.┬Ā10
Summary of concentration vs downstream distance in summer season, effluent velocity is 0.5m/s
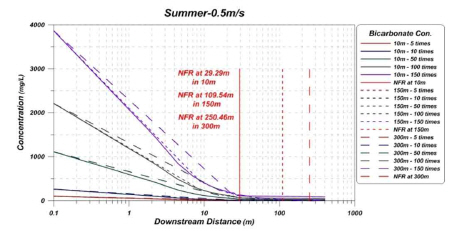
Fig.┬Ā11
Summary of concentration vs downstream distance in summer season, effluent velocity is 1.0m/s
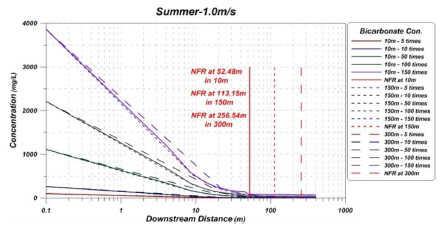
Fig.
10 & Fig.
11 show the variation of excess concentration with respect to downstream distance and discharging depth from the discharging point during summer time. At first, when the effluent flow rate becomes high, a strong momentum will be created at the earlier stage of release and this cause extension of the distance from release point to NFR. On the other hand, it shows that arrival time and dilution rate at NFR are reduced. Secondly, NFR distance from DIC discharging at 10m depth shows the shortest. As vertical mixing is active at the mixed layer (10m depth) due to surface wind effect and buoyancy, it creates unstable entrainment water, accelerates the initial dilution of discharged DIC, and therefore causes reduction of the distance from the releasing point to NFR. Especially, due to the effect of seasonal thermocline and rapid increase of sea surface temperature from strong solar radiation energy during summer time as shown in Fig.
6, wind impact is decreasing, mixed layer thickness is reduced together with increase of thermocline thickness. For 150m depth discharge where stable entrainment water located, it shows that the NFR distance with respect to decay coefficient of DIC concentration is almost constant and the impact of DIC concentration ratio is minimum.
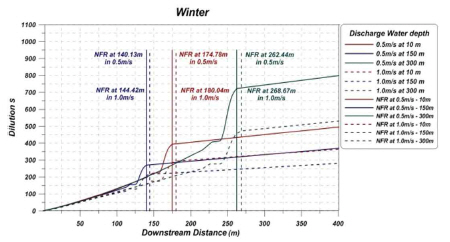
Fig.
12 & Fig.
13 shows the variation of excess concentration during winter time. At first, when the effluent flow rate becomes high, it shows an extension of the distance from release point to NFR arrival time and reduction of dilution rate at NFR similar to summer season. Secondly, NFR distance from DIC discharging at 150m depth shows the shortest compared with summer. As vertical mixing is so active at the mixed layer due to strong surface wind effect during winter and low sea surface temperature, and therefore become the shortest distance from the releasing point to NFR. For comparison of mixed layers between 10m and 150m depth, the initial dilution is accelerated at the depth of 150m and therefore it shows shorter NFR distance compared with 10m depth. As the NFR distance with respect to decay coefficient of DIC concentration is almost constant, it is said that the impact of DIC concentration ratio is minimum as shown in Fig.
14 & Fig.
15.
Fig.┬Ā12
Summary of concentration vs downstream distance in winter season, effluent velocity is 0.5m/s
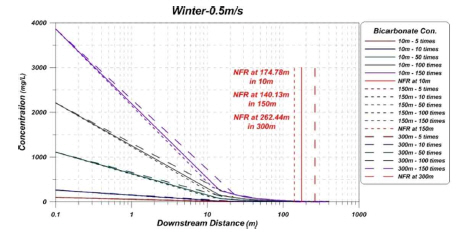
Fig.┬Ā13
Summary of concentration vs downstream distance in winter season, effluent velocity is 1.0m/s
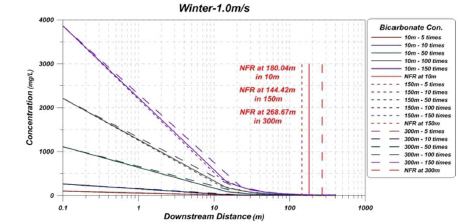
Fig.┬Ā14
Summary of dilution vs downstream distance is summer season
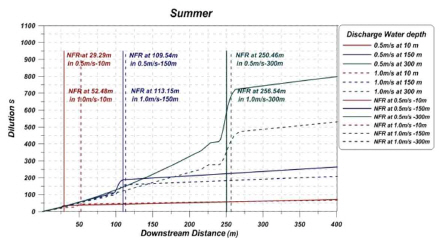
Fig.┬Ā15
Summary of dilution vs downstream distance in winter season
4.3 Environmental Impact Assessment
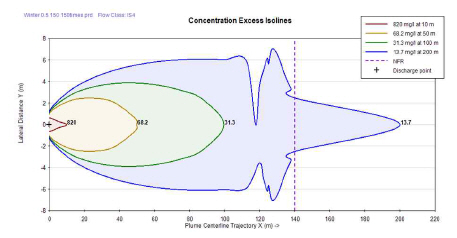
For the environmental impact assessment of marine ecology, PNEC (the Predicted No Effect Concentration limit) was analyzed. This is concentrations that are expected to have no adverse effects on the marine living body when exposed to chemicals. In general, evaluation coefficients are adopted by sensitivity analysis for the selected 8 groups with 16 species of marine biology, which are DIC concentration of 44.4mg/L for protection of 99% of marine biology and 221.9mg/L for protection of 95%. From simulation, excess concentration area were analyzed. Fig.
16 & Fig.
17 show summary of concentration excess iso-lines during summer & winter seasons under the condition of discharging DIC concentration as 150 times enriched. It is noted that concentration rate of the excess DIC discharged, during winter season, was dropped to 13.7mg/L from sufficient dilution before the particles reach to NFR. This meets protection limit of 99% of marine biology. However, for summer season, as DIC concentration near NFR was not dropped sufficiently, it did meet only protection limit of 95%. Therefore, for operation of DIC discharge during summer season, there should be some adjustment on the excess DIC concentration for initial release from the ship.
Fig.┬Ā16
Summary of concentration excess iso-lines in summer season
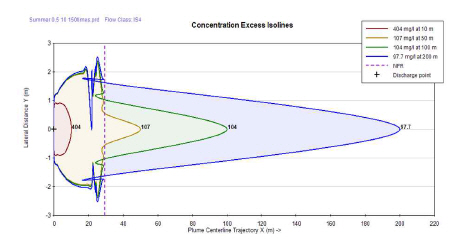
Fig.┬Ā17
Summary of concentration excess iso-lines in winter season
5. Summary and Conclusion
This study confirms the behavior of dissolved inorganic carbon (DIC) materials contained in concentrated seawater and examines the impact to the marine ecosystem through further experiments. Bicarbonate ion enriched sea water discharge scenarios were applied to environmental prediction model (CORMIX) with analyzed physical parameters. Conclusions are summarized as follows:
1) Each scenarios, the excess concentration according to the degree of enrichment increases with the experiment, but the effect of the decay coefficient is insignificant.
2) Each scenarios plume show a negative buoyant motion and move to the bottom, which is the same regardless of season, discharge rate, DIC concentration.
3) The vertical mixing flow of water related on initial dilution rate around the discharge area is determined to seasonal thermocline in the object sea area. In case of discharge area is mixed layer, initial dilution is accelerated due to high instability of ambient sea water. However, in case of discharge area is thermocline area, initial dilution is reduced due to a stable density layer and consequentially, NFR becomes longer.
In this study, it was found that consideration of sea density stratification at the site is important for adoption of DIC discharge method and discharge into the mixed layer is the most effective approach where the vertical mixing flow is very active from the entrainment of seawater, and it is not relied on the seasonal variance. Although it was found that the moving DIC discharge through towed pipe from ship to be the most promising approach, it is necessary to investigate DIC discharge with other parameters such as alignment of diffuser, types of diffuser, etc.


 PDF Links
 PubReader
 Full text via DOI
 Download Citation
 Print
Print