

1. Introduction
Numerous cities of the world are known internationally because they are port-cities. Well known examples of port-cities are Hamburg in Germany, Rotterdam in the Netherlands, Antwerp in Belgium, Singapore and Miami in the USA. The typology of port-cities can be defined according to several factors. One of the most common factors used to categorize port-cities is by assessing the size of the city and the port. For instance, Ducruet and Lee (2006) proposed a categorization in which the city size can be grouped as small, medium or large and port traffic small, medium or large. Port-cities are therefore ranging from small coastal port town if the city is small and the port throughput is small to world port cities if the city and the port traffic are both large.
This study focuses its analysis on the port-city of Busan, which according to the size of population of over 3.5 million citizens (National Statistical Office of the Republic of Korea, 2018) and the traffic of the port handling over 20 million container (LloydŌĆÖs List, 2018) in 2017, can be defined as a world port city. As the port-city of Busan experienced a strong container throughput growth coupled with a moderate increase in population in the last decades, Busan New Port was planned and developed in order to increase the total port capacity.
One of the major challengers currently faced by port-cities is to carefully consider the balance between port competitiveness and benefits for the local population. The most common way to assess port competitiveness is by benchmarking cargo throughput handled by the port in a single year. Increasing volume of cargo handled at ports reflects the efficiency of port operations, activities and the ability to attract customers. When a port is competitive at an international level it generates numerous tangible and intangible benefits to the population in form of jobs and value added creation at a local and regional level. It also increase a countryŌĆÖs connectivity in international trade by lowering time and costs of cargo imports and exports.
However, large port are responsible for generating negative effects which can range from air emissions to noise, dust, security issues, road traffic and accidents. These factors can significantly affect citizensŌĆÖ lives in various ways such as health and respiratory problems, delays and cultural changes.
As ports are sometimes located in the middle of large urban conglomerates, there has been a trend to develop new port projects outside the city center. It has a twofold benefit: firstly, it can add capacity to the whole port if needed; secondly, it minimizes some of the negative effects perceived by the local population by shifting away portŌĆÖs activities and logistics operations.
Examples of ports which have been redeveloped away from the city are the the port of Shanghai which moved from the old port to Yangshan, Rio de Janeiro to Sepetiba, Marseille to Fos and Bremen to Bremerhaven (Merk, 2013).
This paper contribution aims at analyzing what the perception of Busan citizens towards the port. The case of Busan as port-city fits well for the research as it holds the pivotal characteristics of global competitive port and a large population center. The study aims at answering what id the citizensŌĆÖ perception of the port and what are the decisional factors affecting their judgment. Additionally, the paper contributes at assessing whether the current portŌĆÖs initiatives are effective instruments to communicate with the local population or should be they readdressed and implemented more efficiently.
The paper is structured as follow: section 2 review the existing literature of portsŌĆÖ impacts on cities, sections 3 introduces the Q methodology applied, section 4 analyses the studyŌĆÖs results, section 5 set the conclusion with suggested policy recommendations and limitations of the study.
2. Literature review
The link between local citizens and the port is unique to each port-city. Ports are responsible for generating a wide range of impacts over the city, the region and, in some cases, the whole country.
Value added and employments are pivotal effects of port activities for the local population of the port-city. These socio-economic impacts are strictly correlated upon the size and cargo handled in the port. In fact the larger the port, higher levels of value added can be created. According to the study conducted by Merk, in which several word-wide ports were analysed, one ton of cargo handled by the port creates on average 100 USD of value added. Specifically to US ports, it was estimated that one ton of cars creates on average 220 USD, one ton of containerized cargo 90 USD and one ton of grain 20 USD.
It was also calculated that a port on average create approximately 800 direct jobs for each one million tons of cargo handled in the port (Merk, 2013).
Value added and employment are effects which can stretch much further than the impacts generated purely by the port itself. There are four types of portŌĆÖs impacts which are summarized as direct, indirect, induced and catalytic impacts (Ferrari et al., 2010). Direct impacts are generated by the commercial activities of the port itself like ship operations and cargo handling services. Indirect impacts include jobs and value added creation by companies which are strictly and directly dependent on the port business such as suppliers or repair and maintenance activities. Through purchases of goods and services by those employed in the port at a local and national level, induces impacts are created. Finally, catalytic effects are those jobs and value added created by firms and corporation relocating in the port area because of the efficiency and competitiveness of the port.
A wide number of institutions, consulting firms, port authorities and governmental bodies regularly produce annual report aimed at highlighting the socio-economic importance of ports. This can be a useful marketing tool to show taxpayers the benefits of the local port. For instance, the National Bank of Belgium (NBB, 2015) was the body involved for the development of a report about the economic importance of Belgian ports (Antwerp,Ghent, Ostend and Zeebrugge) (NBB, 2015). Other examples are Martin Associates for the ports of Houston HPA, Los Angeles, Jacksonville, Seattle/Tacoma and Baltimore (Martin Associates, 2007; Martin Associates 2007b); Maritime and Port Authority of Singapore (MPA Sinagpore, 2015); EconSearch for Sydney (EconSearch, 2003); the Port Authority of Le Havre for Le Havre (Merk et a., 2011) and InterVistas for the Canadian ports of Vancouver (InterVistas, 2017), Toronto (Martin Associates, 2018), Price Rupert (InterVistas, 2017b).
However, ports are also responsible for causing negative effects such as emissions, noise, dust, odor, visual impacts, road traffic and security issues. According to a survey carried out by the International Maritime Organization (IMO) the most concerning issues for ports today are air emissions and noise pollution (IMO, 2015) Ship emissions in portsŌĆÖ area are very significant in numerous regions across the word in terms of CO2, NOx, SOx and PM10. In the 50 largest ports in the OECD they are responsible for significant socio-economic cost; it was estimated that about 230 million people are affected by emission in the one hundred (100) largest ports worldwide and an economic cost of approximately 12 billion EUR peach year when considering the top fifty (50) ports in the OECD (Merk, 2014).
Initiatives aimed at reducing portsŌĆÖ emissions have been undertaken by several ports worldwide. The port of Los Angeles has implemented strategic measures to reduce greenhouse gas (GHG) and harmful emissions in the port area by a vesselŌĆÖs peed reduction program. The port authority has offered incentives to those ships slowing to twelve (12) knots within twenty (20) nautical miles from the port and this program has contributed to lower, from 2005 to 2014, PM by 85% and sulfur oxides by 97% (Port of Los Angeles, 2019). The port of New York has focused on several areas to successfully tackle air emissions such as the use of renewable energy, clean vehicle, energy efficiency improvements and offered incentives to those ships which voluntarily reduce emissions (The Port Authority of New York and New Jersey, 2019). The port of Gothenburg in Sweden has committed to minimize the environmental impacts in the port area; the port authority aims at cutting emissions by implementing a higher number of quayside power connections, bunkering of Liquefied Natural Gas (LNG) and offering incentives to ships generating low-level emissions (Port of Gothenburg, 2017).
The port of Rotterdam has invested in a sustainability program to achieve a balance between an optimum use of land, accessibility and air quality, all key areas the port authority deem as necessary for growth and consensus. The port of Rotterdam has recognized the importance of guaranteeing citizens a satisfactory quality of life around the port and has taken several steps to reduce air emissions such as using sulphur-free diesel for own portŌĆÖs fleet, promoting clean ships by offering discounts on port dues and onshore power supply (Prinssen, 2012).
Due to the complex and wide operations taking place in port areas, noise is one of the negative impacts which can affect both the maritime and natural environment as well as the urban population. Noise is generated from several sources in the port area as merchant ships, cruises, ferries, tugs, barges but also from loading discharging operations of cargos, vehicles and from port-related activities like shipyards, repair and maintenance companies and industries.
The European Seaports Organization (ESPO) has highlighted that European seaports perceive noise as one of the most challenging impacts which need to be reduced (ESPO, 2013). Noise pollution, if not monitored and reduced, can negatively impact citizensŌĆÖ health and, consequently, port imageŌĆÖs perception. For instance, noise pollution effects have deteriorated KoperŌĆÖs inhabitants as a result of port activities (Dragan & Muley, 2018). In the port of Barcelona, cruise portŌĆÖs activities can also generate noise pollution affecting both workers and cruise passengers alike (Alsina-Pages et al., 2018). Ports should hence closely monitor noise zones and their causes as well as implementing actions aimed at improving operations and policies (Schenone et al., 2014).
Port-cities may be impacted by increased levels of road congestion (Allen, Browne and Cherrett, 2012). In particular, urban traffic around the port can significantly increase in ports whose main traffic is containerized cargo. Containers transported inward and outward the port area by trucks increases the road traffic levels which in turn raise air emissions and road accidents. Large port cities such as Antwerp and Rotterdam, which have a large portion of container traffic, have registered increased levels of road traffic in the city (De Borger and De Bruyne 2011).
As much as positive impacts are maximized and negative impacts are limited, it is more likely for the relationship of port-city and population to be stronger over time. However, there are also other factors with can influence such relationship; an historical port might be considered as an integral part of the city whilst a newer port might be sensed as more alien to the community. Similarly, if the port itself is successfully competing at an international level or local corporations operating in it are renowned worldwide there may be a sense of pride felt by local citizen who would strengthen the bond city-port.
There are a number of ports which have fully recognized the importance of a strong port-city citizensŌĆÖ relationship and they have been involved in numerous marketing and educational initiatives targeting the local population. The Port of Rotterdam started an educational program targeting secondary schools, vocational institutions and university students; the port of Melbourne targeting young children of grade five and sixŌĆÖ the Port of Antwerp for children of primary and secondary school; the port of Los Angeles from 4th grade to college (Merk, 2013).
Ports are increasingly interested in reporting the positive impacts and the social initiatives which benefit the local and regional population. Nevertheless, the key issue is to find an optimum balance between positive benefits and negative externalities in the eyes of the public. Therefore, the citizensŌĆÖ perception of the port is a topic which needs more attention in view of a renewed marketing strategies and social dialogue of ports.
3. Methodology
3.1 Research question
This study utilizes Q methodology to analyse and evaluate Busan citizenŌĆÖs perception of the local port.
Q methodology has been originally developed by Stephenson in 1936 (Stephenson, 1936) in order to evaluate a set of individualsŌĆÖ beliefs, value and attitudes (Stephen, 1985) as a way to asses peopleŌĆÖs subjectivity on a specific issues and understand phenomena (Brown, 1996) and highlight variance on perspective to the research subject (Kitzinger, 1987).
The methodology uses both elements of quantitative and qualitative research and it has been widely utilized in social sciences. Past research has focused on different sectors as healthcare (McHugh et al., 2019), health economics (Baker et al., 2006), health informatics (Valenta & Wigger, 1997), education (Grover, 2013), tourism management (Stergiou &Airey, 2011; Lee, 2019), environmental issues (Demirovic et al., 2017) and customer service (De Tran & Doroffeva, 2018).
Q methodology has several advantages; it provides the opportunity to analyses and evaluates different opinions of the participants (Hughes, 2012; Simons, 2013), the subjectivity is deemed to be a strength as the participantsŌĆÖ beliefs are highlighted (Brown, 1996), it limits the bias of researchers (Previte et al., 2007), it facilitates the identification of the participantsŌĆÖ features and their significance on perceptions of the research (Simons, 2013).
Specifically to the maritime logistics industry there is a very limited number of papers using Q methodology. The image of seafarers in Spanish newspapers has been researched by using Q methodology and it was found that the subject is not often published in Spanish newspapers and overall the image of seafarers is negative (Sanchez-Beaskoetxea & Coca-Garcia, 2015).
Q methodology has been applied to the port sector in one study only to find out the factors affecting port users in port choice and provides recommendations to improve portsŌĆÖ competitiveness (Kim, 2014).
In this study, Q methodology is applied as it is a suitable methodology for carrying out this research by using subjective opinions of BusanŌĆÖs citizens to gain a deeper and holistic understanding of the local portŌĆÖs public perception. The paper aims at answering the following questions: 1) what is the awareness of Busan citizens about the port 2) what factors are perceived as positive and which ones as negative 3) what factors need to be improved in the eyes of citizens to strengthen the port-city relationship.
3.2 Research design
To correctly apply a Q methodology process, there are five steps which need to be taken namely concourse, Q sort, Q sort activity, factor analysis and factor interpretation (Simons, 2013). In this research paper, the first step that was carried out is concourse; in this stage, discussion about opinion and beliefs about perception of Busan citizens of the local port has been carried out and more than one hundred (100) statements were initially drafted. Various sources were utilized to create the statements such as academic papers, news in specialized maritime magazines and newspapers, opinions from academics and researchers in the area of maritime logistics. Q sort identification was then carried out and one hundred (100) statements were reduced to sixty (60). The selection of the sixty (60) statements was carried out by two people with experience in the maritime logistics sector from two leading research institutes in Busan. These statements are deemed representative as they encompass a holistic view of the subject and taking into account all the angles of the research topic in terms of subjectŌĆÖs depth and comprehensiveness. In the next stage, the author randomly selected forty six (46) participants, referred as P-sample, all residents in the city of Busan with different sex, ages, neighborhoods of residence and education. The P-sample included a total of twenty-two (22) males, twenty-four females (24); respondents in the age 20-29 included 3 males and 8 females, in the age of 30-39 there were 6 males and 8 females, in the age of 40-49, 10 males and 6 females and in the age 50-59, 3 males and 2 females. However, in the final analysis 12 respondentsŌĆÖ answers sheets were not included due to low eigenvalues and variance. The final participantsŌĆÖ number of 34 is reasonable and sufficient to find out individual viewpoints of the topic and it is in line with SimonsŌĆÖ study (Simons, 2103).
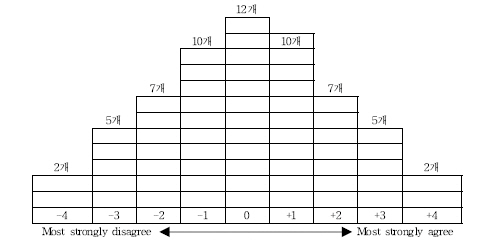
The P sample participants were then given 60 statements cards in a randomized order, a Q grid matrix with 60 blank spaces in which each participant was asked to place each statement card according to his/her opinion on a scale ranging from -4 (strongly disagree), to +4 (strongly agree) as shown in Table 1. The Q grid matrix follows a forced normal distribution and was an online form in where the participants answered the q-sort.
4. Analysis and results
The analysis of the results was carried through the use of package PQMETHOD. In order to correlate all participantsŌĆÖ sort, VARIMAX rotation was performed. Four different factors were extracted and the variance calculated.
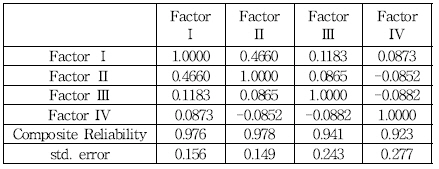
These factors will be named in section 3.1, after the analysis of Z-scores is performed and an evaluation of common statements belonging to each factor is carried out. Factor one (1) explained 19% of the total variance of the study, factor two (2) 7%, factor three (3) 5% and factor four (4) 4%. The four (4) factors represent thirty five percent (19% + 7% + 5% + 4% = 35%) of the study variance. Figures in the 35%-40% range are considered significant for the analysis. Eigen values, variance and correlations between factors are shown in Table 2 and 3.
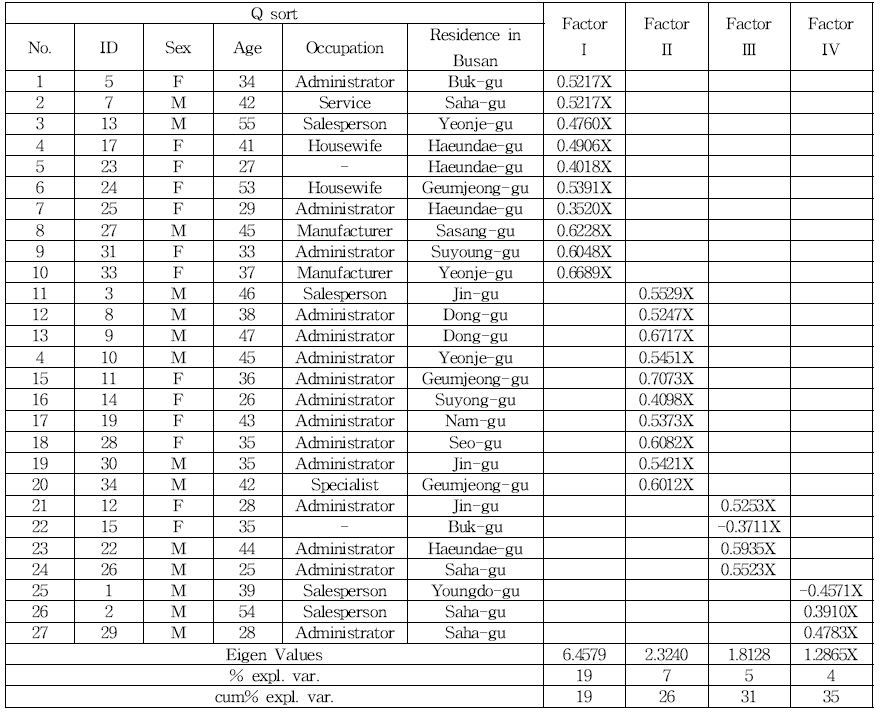
Loading scores per each factor type are depicted in Table 2. To each participant is assigned a loading score which, the higher it is, the more that particular person is significant to the factor assigned.
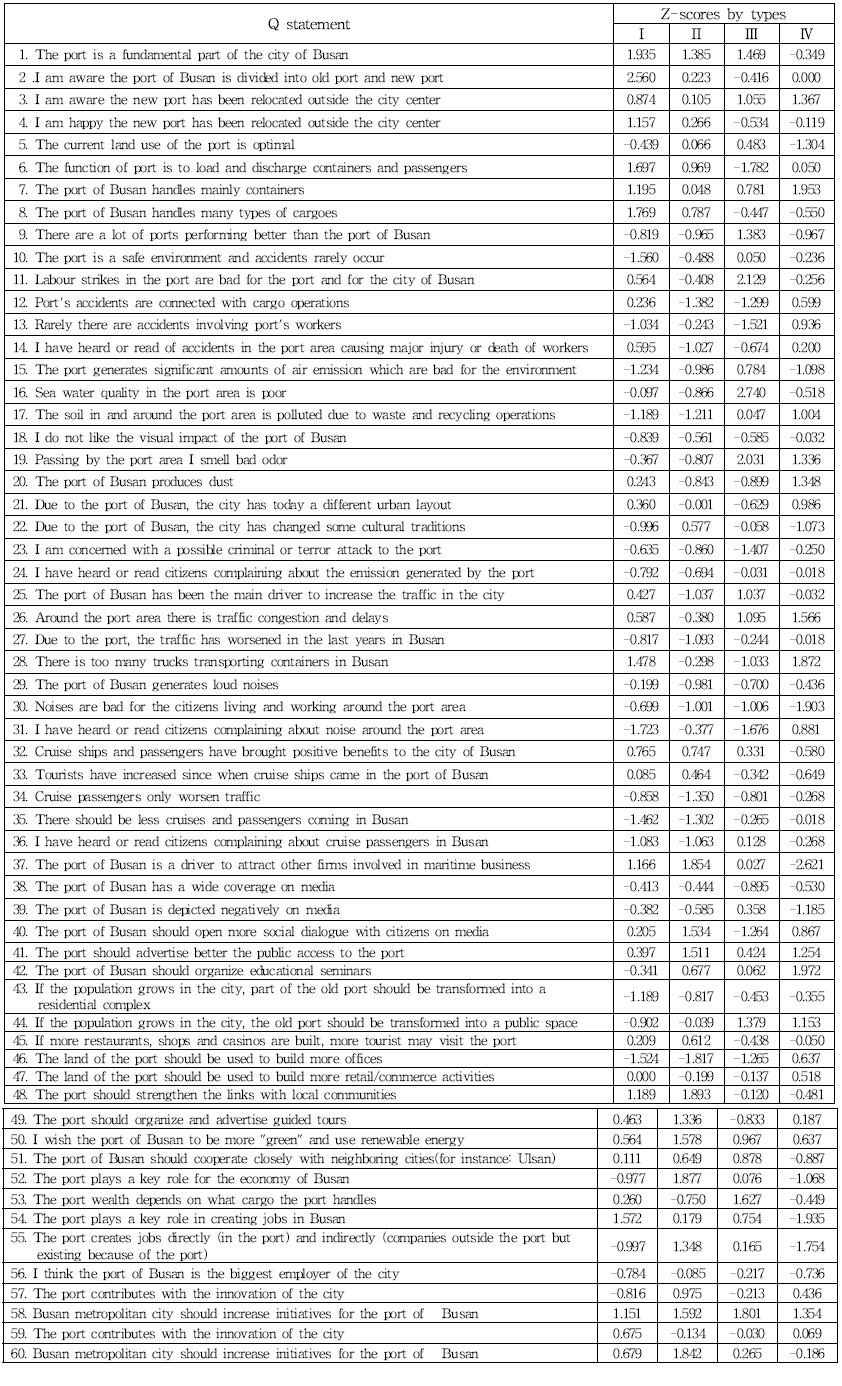
The interpretation the peculiarities for each of the four factors was derived by analyzing a descending array of differences between each pair of factors and Z-values for each of the 60 statements as depicted in Table 4. Z-values ranged from negative (-), to neutral (o or close to 0), and positive (+). In this study, the author selected statements showing significant Z-values for each factor, with value above 1 (agree and strongly agree) or below 0 (disagree or strongly disagree).
4.1 Analysis of factors
The four factors were analysed and named based on the Z-values of the statements. They were renamed as follow: factor one (1) Port functional factors knowledge; factor two (2) factor three (3); factor four (4).
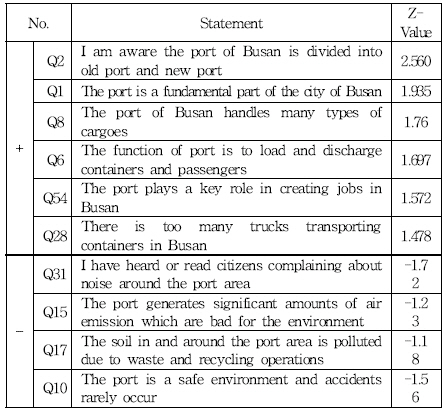
Factor I was named ŌĆśport functional knowledgeŌĆÖ. The participants of this group showed a deep awareness of the function of the port of Busan for questions (Q) (Q2, Q8, Q6, Q28) and strongly agree that the port plays a key role for the city (Q1,Q54). Persons clustered in factor 1 strongly disagreed with statements related to environmental pollution generated by the port area as shown by negative factors score for Q31 (Z= -1.72), Q15 (Z= -1.23), Q17 (Z= - 1.18).
On the other hand, they believe the port is not a safe environment and accident do occur (Q10, Z= -1.56). Similarly, factor 1 individuals perceive the cruise business as not negative for the city (Q35 (Z= -1.46) and Q36 (Z= -1.08). Statements Q35 and Q36 were shared by individuals clustered in factor 2. Table 5 summarizes the most agreed and disagreed statements for factor I.
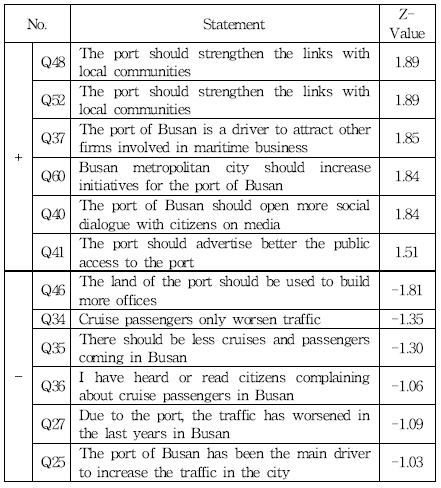
Factor II was labeled as ŌĆślack of social connectedness port-cityŌĆÖ as individual of this group believe there is lack of social connectedness port-city. It is strongly agreed that the port should increase social initiatives as shown by Q48 (Z=1.89), Q60 (Z=1.84), Q40 (Z=1.53), Q41 (Z=1.51). On the other hand they perceived the port of Busan as a pivotal economic engine of the city highlighted by Q52 (Z=1.87) and Q37 (Z=1.85). Respondents strongly disagreed that the portŌĆÖs land should be destined to other activities such as developing commercial offices (Q46, Z= -1.81). Similarly to factor I participants, they perceive cruise business not a negative factor as it does not worsen city traffic (Q34, Z= - 1.35; Q35, Z= -1.30; Q36, Z= -1.06). Also it is believed that the port is not the main driver in city congestion (Q27, Z= - 1.09; Q25, Z= - 1.03). Table 6 shows the most agreed and disagreed statements for factor II.
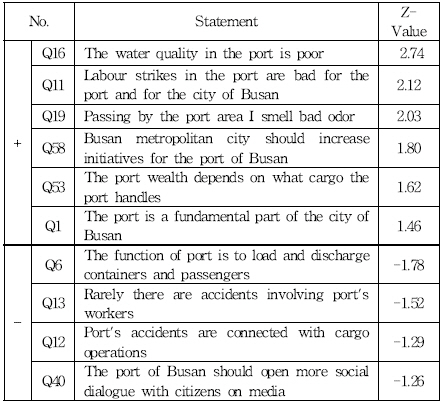
Factor III was defined as ŌĆśenvironmentally concernedŌĆÖ and the respondents mainly agree on notions regarding environmental impacts of the port of Busan. Although there is a significant perception of this group that the port play a key role for the city (Q53, Z= 1.62; Q1,Z= 1.46) and recognize that stoppage can affect the economy of the city (Q11, Z= 2.12), this group is mainly concerned with the environmental factors affecting the city and its inhabitants as shown in Q16 (Z= 2.74) and Q19= 2.03). Participant in this factor strongly disagreed with statement Q6 (Z= -1.78) about the functions of Busan port, Q13 (Z= -1.52) and Q12 (Z= -1.29) about accidents related to operations. This group also disagreed with statement Q40 (Z= -1.26) implying the port of Busan is currently effectively communicating with citizens on media. Table 7 shows the most agreed and disagreed statements for factor III.
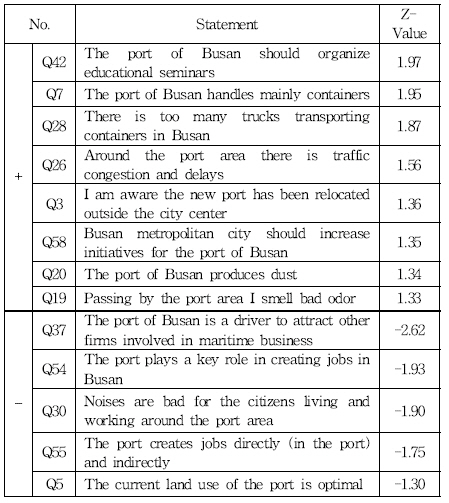
Factor IV was named as ŌĆśabsent portŌĆÖs ripple effectŌĆÖ. There was a strong agreement about the port of Busan and Busan metropolitan city to organize more initiatives (Q42, Z= 1.97; Q58, Z= 1.35), the functions of the port (Q7, Z= 1.95; Q3, Z=1.36), congestion factors (Q28, Z=1.87; Q26, Z= 1.56) and environmental factors (Q20, Z= 1.34; Q19, Z=1.33). The group was labeled as ŌĆ£absent portŌĆÖs ripple effectŌĆØ because factor IV respondents strongly disagreed with statements which can be categorized as ripple effects, or socio-economic effects that the port of Busan creates. Table 8 depicts the most agreed and disagreed statements for factor IV.
4.2 Similarities and Differences
This section highlights the peculiar characteristics of each of the selected factors as indicated in Fig. 1.
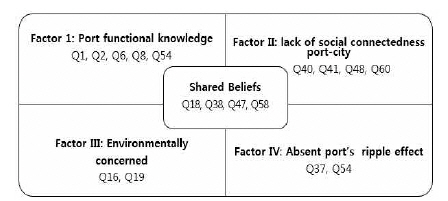
There are four (4) statements which have been shared among all respondents of the factors and known as consensus in Q-methodology. The following statements are show below in Table 9.
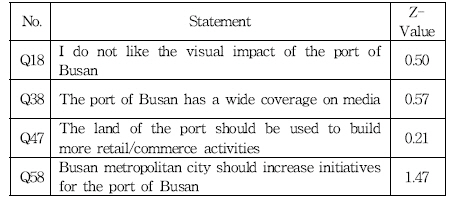
All participants of the study have a strong perception that the visual impact of Busan is not liked, the port has a wide coverage on media but still citizens believe Busan Metropolitan city should be the public body to interface with local population and increase social initiatives. Also, it is believed that the land of the port should be used to develop residential and commercial activities.
Major differences between factor I and II were highlighted in statements number two (Q2) (Z=2.33), twenty eight (Q28) (Z=1.77), fourteen (Q14) (Z=1.62) and, interestingly with regarding to the role played by the port for the city of Busan in statements fifty two (Q52) (Z= -2.85) and fifty five (Q55) (Z=-2.34)
Different views of participants were also retrieved for factor II and III about the functional characteristics of the port (Q2; Z=2.97 and Q6; Z=3.47) and environmental factors (Q16; Z=2.83 and Q19; Z= 2.39). Between factor I and IV strong disagreements arose about the socio-economic role of Busan port (Q37; Z==3.78 and Q54; Z= 3.50), noise (Q31; Z= -2.6) and the organization of education seminar by Busan Port Authority (Q42; Z= -2.31)
Respondents belonging in factor II and III showed significant different in relation to opening more social dialogue with the citizens (Q40; Z= 2.79), the main portŌĆÖs business (Q6; Z=2.75) and environmental factors (Q16; Z= -3.60 and Q19;Z= -2.83).
Different perspectives were also expressed between factor II and IV about the port of BusanŌĆÖs role as driver for firmsŌĆÖ attractiveness and jobs creation (Q37; Z= 4.47 and Q55; Z= 3.10), land use (Q46; z= -2.45) and soil pollution due to portŌĆÖs activities (Q17; Z= -2.21).
Finally, differences in the portŌĆÖs image perception for factor III and IV were concentrated on environmental impacts (Q16; Z=3.25 and Q31; Z= -2.55), jobs creation (Q54; Z= 2.68) and traffic (Q28; Z= -2.90).
5. Conclusion
This study utilizes a Q methodology to evaluate the unique perception of Busan citizens about the port. In the literature review section, multiple positive and negative impacts generated by seaports have been discussed and comprehensively included into the research design.
Q methodology approach is a useful tool in evaluating what are the image and the perception of the effects produced by the port towards the local community. The paper aims at filling the gap of evaluating the perception of Busan citizens over the local port in view to gain an understanding on what portŌĆÖs factors mostly affect the perception of the local population and what policies should be implemented to improve the port-city relationship. This is the first attempt to gain a deeper understanding in the issue as past literature mainly focused on customer service levels of ports for shipping companies, shippers, logistics companies and port users in general.
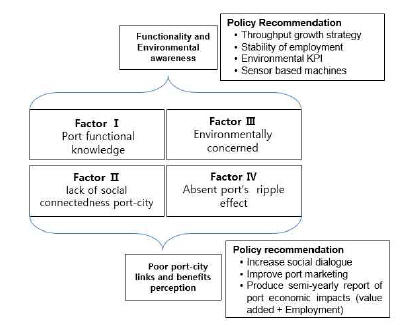
In the study, four factors have been derived from the analysis carried namely 1) port functional knowledge; 2) lack of social connectedness port-city; 3) environmentally concerned and; 4) absent portŌĆÖs rippleŌĆÖs effect. Each of these factors showed peculiarities in terms of citizensŌĆÖ knowledge and awareness of the port. For instance, factor I participants showed an appreciation of the functional and economic role the port plays for the city; factor II respondents felt that the port should improve the links and social initiatives with the local community; factor III persons have a perception of the port as environmentally-conscious and more actions should be taken to minimize water pollution and odor; factor IV respondents have an image of the port as an industry which is not bringing major socio-economic benefits for the city of Busan.
Fig. 2 shows the four factors typology and policy recommendations for each of them. Factor I and III have a tangible perception of the port of Busan in terms of functionality and environmental impacts. In order to maintain this awareness stable it is important to pursue a cargo throughput growth strategy and maintain employment stability. Also, in order to minimize environmental impacts, publishing environmental key performance indicators (KPI) to benchmark neighboring ports can positively influence citizensŌĆÖ perception. On the other hand, factor II and IV bear an intangible awareness of the port as it is perceived as a body distant from the citizens and creating very limited economic benefits. In this case, increasing social dialogue, improving port marketing strategies and producing a semi-yearly report of the port economic impact (value added and employment) can be powerful tools to improve the port image towards the local community.
The study has taken into account a small population to carry out the analysis and this may be a limitation as the subject issue is very broad. However, Q methodology has been widely utilized to analyze wide behavioral patterns only considering small population samples and this is a major advantage. The same topic should be further addressed by confirming the results with a different methodology and a wider sample by comparing, for instance, portŌĆÖs awareness between citizens and expert in the maritime industry. Future research can also contribute to the subject by analyzing more specifically if portsŌĆÖ perception is influenced by cargo types, port history, port users and comparing results for ports located in different regions.
 PDF Links
 PubReader
 Full text via DOI
 Download Citation
 Print
Print