Nearshore Current Pattern and Rip Current Occurrence at Jungmun Beach, Jeju by Numerical Computation
Article information
Abstract
A nearshore current or a wave-induced current is an important phenomenon in a nearshore zone, which is composed of longshore, cross-shore, and rip currents. The nearshore current is closely related to the occurrence of coastal accidents by beachgoers. A considerable number of coastal accidents by beachgoers involving the rip current have been reported at Jungmun Beach. However, in studies and observations of the nearshore current of Jungmun Beach, understanding of the rip current pattern remains unclear. In this study, a scientific approach is taken to understand the nearshore current and the rip current patterns at Jungmun Beach by numerical computation for year of 2015. From results of numerical computation, the occurrence and spatial characteristics of the rip current, and the similarities between the rip current and incident wave conditions are analyzed. The primary results of this study reveal that the rip currents are frequently generated at Jungmun Beach, especially in the western parts of the beach, and that the rip currents often occur with a wave breaking height of around 0.5 ~ 0.7 m, a wave period of around 6 ~ 8 seconds, and a breaking angle of around 0 ~ 15 degrees.
1. Introduction
A nearshore current or a wave-induced current consisted of longshore, cross-shore, and rip currents is generated by incident waves at a nearshore area, and it has been known as important factor with respect to sediment transport and diffusion of pollutant within an onshore region. Since a development for the nearshore current including a concept of a radiation stress by Longuet-Higgins and Stewart (1964), a considerable number of researches have been carried out in South Korea as well as around the world (Kim and Lee, 1998; Kim and An, 2011).
Since importance of the rip current involved with coastal accident to beachgoers perceived, researches on the rip current have been widely implemented from the end of 2000s. According to Ministry of Oceans and Fisheries (MOF) of South Korea, it has been turned out that there were a significant number of safety accidents for beachgoers related to the rip current every year, and are shown in Table 1.

Typical examples of accidents due to the rip current in South Korea is Haeundae beach (Choi et al., 2012; Yoon et al., 2012). Choi et al. (2014) developed warning system based on real time observations for Haeundae beach, which is helpful to prevent safety accident for beachgoers due to the rip current at Haeundae beach.
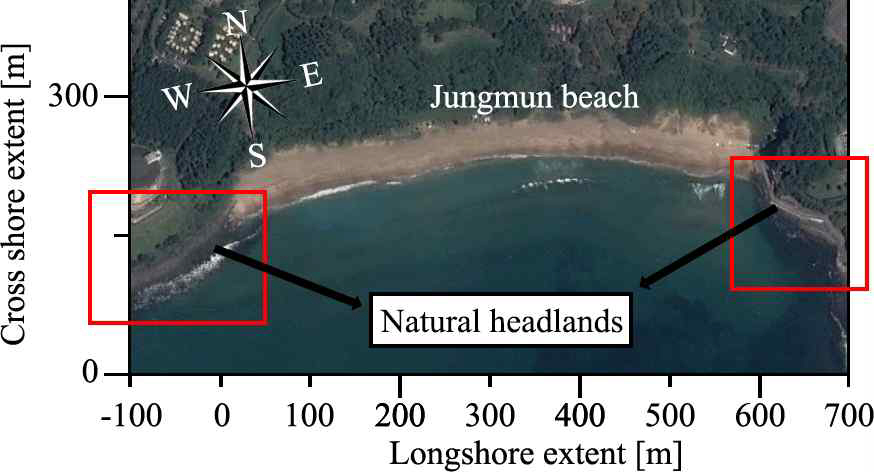
Jungmun Beach is one of the famous attractions located in Jungmun Tourism Complex, Seogwipo, Jeju (Fig. 1). Many people have been visiting Jungmun Beach every year, and safety accidents for them due to the rip current repeatedly occur here every year, implying that the nearshore current at Jungmun Beach should be understood to scientifically approach above matters, but researches on nearshore current at Jungmun Beach are not entirely conducted.
Study area
In this aspect, this study tries to identify annual generation pattern of the nearshore current and the rip current in year of 2015 using a numerical computation. The rip current is detected by checking direction of cross-shore velocity component at breaker lines. If cross-shore currents are flowing to the offshore, it is considered as the rip current. In this study, Outbreak patterns of the rip current are computed and compared with incident wave conditions to infer mutuality between the rip current and wave states.
2. Methodology
2.1. Study area
A study area is Jungmun Beach facing the Pacific Ocean located in southwest Seogwipo, Jeju, as shown in Fig 1. Jungmun Beach is 0.6-km-long sandy beach and a slight headland-bay type beach pocketed by rocky, or gravelly western (Longshore extent: -100 ~ 0 m) and eastern (Longshore extent: 600 ~ 700 m) natural headland of the beach as marked with red boxes in Fig. 1.
As mentioned above, there are a considerable number of safety accidents for beachgoers at Jungmun Beach. During swimming season (July ~ August), the rip current have frequently been appeared. Therefore, beachgoers have been hazarded and suffered by the rip current, meaning that swimmers are swept offshore by the rip current. Fig. 2 is a snapshoot of a safety accident by the rip current on 11 July 2012, around 4:00 p.m. at Jungmun Beach (Jejusori, 2012), and it shows a situation that marine police officers are trying to rescue child swimmer being swept by the rip current. In this context, the rip current patterns at Jungmun Beach should be researched and figured out to prevent safety accidents for beachgoers. Occurrence of the rip current will be estimated, and relations between the rip current and incident wave condition will be analyzed in the following.

One swimmer being swept by the rip current is rescued by maritime rescuers at Jungmun Beach. (Jejusori, 2012).
2.2. Observation and data processing of incident wave
In order to identify the nearshore current patterns, it is necessary to understand incident wave conditions because the nearshore currents are generated and changed by incident waves. Korea Hydrographic and Oceanographic Agency (KHOA) installed a wave-rider buoy (126° 24′ 35″ E, 33° 14′ 4″ N) at Jungmun Beach in November of 2014. Sea states have been observed since wave-rider buoy was installed.
Observational wave data for five minute were analyzed by spectra analysis, and provided significant wave height, wave direction, and wave period on Korea Ocean Observing and Forecasting System (KOOFS) web site (http://www.khoa.go.kr/koofs/kor/observation/obs_real.do) with five minute interval.
In this study, data processing for observational results provided from KHOA were implemented in the following manners: 1) Outlier and errors were removed. 2) After filtering, raw data were averaged and smoothed for 24 hours to manipulate incident wave direction and to reduce total computation time.
Wave rose diagram shown in Fig. 3 indicates that primary incident wave directions are southern types (S, SE, and SSE), and wave heights are almost less than 1.5 m. Seasonal wave conditions converted to shore normal are depicted in Fig. 4.

Wave rose diagram of incident wave conditions in 2015 at Jungmun Beach.

Seasonal wave state in year of 2015.
Top panel is significant wave height. Black solid line is raw data provided by KHOA and yellow dashed line is the filtered and daily-averaged wave height. Although several high wave height including 9th typhoon CHAN-HOM and 15th typhoon GONI are observed during summer season (June-Aug.), wave heights are generally less than 2 m.
Middle panel is incident wave direction. Black solid is raw data and yellow dashed is the daily-averaged data. 0 degree is normal incidence. Positive means that wave is coming from the southeast and negative is from the southwest. As shown in middle panel, incident waves almost come from the southeast except winter season (Dec.-Mar.).
Bottom panel is wave period. Black solid is raw data, and yellow dash is the daily-averaged data, which indicates that incident wave periods generally are within 20 second.
Numerical computation for wave and current fields were carried out with filtered and smoothed data, as described above. Details of numerical computations will be explained in the next section.
2.3. Numerical computation
This study tries to identify the nearshore current patterns at Jungmun Beach using numerical computation, which uses REF/DIF 1 (Kirby et al., 2002) model as wave field computations and SHORECIRC (Svendsen et al., 2000) as current field computations. These models have been popularly used to compute coastal dynamics.
REF/DIF 1 model is a phase-resolving parabolic refraction-diffraction model for ocean surface wave propagation and its development was started in 1982 and the latest version was presented in 2002. Because it is regular wave model, it cannot consider wave direction changed by standing wave or clapotis due to diffraction and reflection of wave. Although REF/DIF 1 is regular wave model, it is useful to predict wave deformations within nearshore zone. Detail for REF/DIF were described by Kirby et al.(2002) and the coastal engineering manual part II (EM 1110-2-1100, 2008). Jungmun Beach, study area of this work, is almost natural beach without artificial constructions causing standing wave, and has mild bottom slope. Consequently, standing wave matter can be minimized, and REF/DIF 1 may compute wave deformation at Jungmun Beach well.
SHORECIRC model is quasi-3D nearshore circulation model including effects of short wave forcing, wind stresses, non-linear mechanisms, and the vertical variation of currents, and its development was started in 1992 and the latest version was presented in 2004. The concept of the Quasi-3D equation is to combine 1D undertow and 2D circulation models. Details of SHORECIRC were described in Svendsen et al. (2000).
An and Takewaka (2016) qualitatively compared shoreline variabilities around T-type groins observed by X-band marine radars to wave energy fluxes obtained by REF/DIF 1 model, and shows good agreement.
Kim and An (2011) computed the nearshore current pattern at Gangjeong coastal area, Jeju, and they carried out to verify RFD/DIF 1 and SHORECIRC models by comparing results given by numerical computations and those given by experiments. As a result, Coastal dynamics, such as wave and current deformation, were well reproduced by these models. Detail of verifications of these model have been provided in Kim and An (2011).
Conditions of the numerical computation are shown in Table 2, and other coefficients, not mentioned in Table 2, are default values in the models. Tidal variations were not considered in numerical computation.

Conditions of numerical computation
Numerical computations were carried out in the following manners: 1) Wave computation was implemented to simulate wave deformation. 2) Current filed computation was conducted with physical value such as radiation stress and mass flux given by wave model. 3) After calculating one cycle (step 1 and 2), wave field was recomputed with current velocity and surface elevation delivered from current model to consider wave-current interaction, and then current field was recomputed after wave field computation.
As described above, in order to identify annual characteristics of the nearshore current and the rip current pattern in year of 2015. Observational wave data were provided by KHOA, and the daily-averaged wave data were obtain by data processing, which use in the numerical computation at input wave condition. Due to some problems and errors on observation, there were six missing days for whole year. Therefore, daily numerical computations for 359 days (i.e. 359 cases) were carried out. Results of numerical computation will be displayed and discussed in the following section.
3. Result
3.1. Computational results for wave and current fields
The results of the numerical computations are depicted in Fig. 5 and 6. Fig. 5 shows surface displacement and distributions of wave heights by wave coming from the southwest (H1/3 = 0.63m, T1/3 = 7.94sec, θ1/3 = 28.71°). Fig. 6 presents distributions of currents by different incident waves. Panel (a) is for southwest, (b) is for southeast (H1/3 = 0.77m, T1/3 = 5.53sec, θ1/3 = 34.5°), and (c) is for almost normal incidence (H1/3 = 0.82m, T1/3 = 7.33sec, θ1/3 = 1.8°).
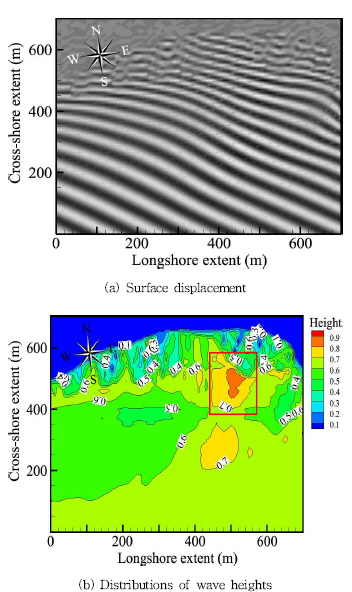
Distribution of surface displacement and wave height by wave coming from southwest.

Distribution of current field
Fig. 5 (a) shows that wave propagations are well simulated, and (b) indicates that relative high wave heights are shown from around 400 to 500 m in longshore direction marked with red box, which may results from energy concentrations, and water depths of that areas are a slightly deeper than those of vicinity. It may become rip-channel, and will be discussed in the following.
Distributions of current patterns are depicted in Fig. 6. Panel (a) is result for current patterns relevant to incident wave coming from the southwest. Longshore currents are generally flowing west to east, but some westward longshore currents are shown in the vicinity of eastern end of the beach, which may be attributed to a slight pocket type beach. As shown in Fig. 1, natural headlands consisted of gravels and rocks are located at eastern and western ends of the beach. As a result, currents are separated by the natural headlands. With respect to the rip current, quite strong rip current are generated from around 350 to 500 m in longshore direction marked with red box, and it may be due to the rip-channel. Also, there are rip currents due to current-current interactions around 650 m marked with blue box. current-current interactions mean that rip currents are generated by interactions of longshore currents flowing the opposite directions. current-current interactions near the end of the beach marked with blue box in panel (a) are attributed to the headland, and it may contributed to the rip current.
Panel (b) is relevant to incidence from the southeast. Westward longshore currents are prevailing, but some eastward currents are observed at western ends of the beach, resulting from the natural headland. The rip currents are also observed around the rip-channel marked with blue box.
Panel (c) is relevant to almost normal incidence. The rip currents are seen around 600 m marked in red box at eastern end of the beach. But the rip currents are not observed around the rip-channel, and rather shoreward currents are prevailing around there, meaning that generation patterns of the rip currents at are different in incident wave direction.
As described above, the rip currents are important in aspects of safety accident for beachgoers. In this context, as explained above, occurrence frequencies of the rip currents were estimated with simple concept, and will be shown and discussed with respect to wave conditions in the next section.
3.2. Rip current
The rip currents occur by compositive influence in regard to morphology and wave condition. In this section, generative features of the rip currents at Jungmun Beach will be investigated with respect to morphology and wave conditions.
With results from the numerical computations, occurrence frequencies of the rip currents were estimated by identifying directions of cross-shore velocity components at the breaker lines along the shore, which means that if cross-shore velocity at breaking point is flowing to seaward, it is considered as the rip current. Occurrence frequency of the rip current is simply calculated as a ratio of rip current case to total days. Furthermore, features of the rip currents are compared and discussed with incident wave height, wave period, and breaking angle collected at the breaker lines to identify mutuality between the rip current and wave condition at Jungmun Beach in the next section.
3.2.1. Occurrence frequencies of the rip current
As delineated above, occurrence frequencies of the rip currents were estimated, and are displayed in Fig. 7. A black dashed line is estimations of occurrences of the rip current over whole year, and a solid line is those for July to August because these periods are swimming seasons. Therefore, most of accidents for swimmers have intensively concentrated during these periods. As shown in Fig. 7, results of estimations indicate that rip currents often occur at Jungmun Beach, as reported in above. Overall occurrence rates are higher than 20 %. Most rates is around 50 % and observed from 180 to 200 m. As a result, beachgoers who enjoy swimming during swimming season may be threatened by the rip currents. Results for occurrences of the rip currents at Jungmun Beach are one of the good reasons why researches on the nearshore current at Jungmun Beach will be consistently and obviously carried out and discussed with respect to scientific aspect in the future.

Frequencies of appearances of the rip current in 2015 at Jungmun Beach given by current field computations.
As described above, the rip current are observed around rip-channel, and there are current-current interaction resulting from beach type of Jungmun Beach. In this context, primary reasons why the rip currents frequently appear at Jungmun Beach are inferred to rip-channel and beach form of Jungmun Beach as pocket beach or a slight headland-bay type.
The rip current are closely related with incident wave condition as well as morphological conditions. Relation between the rip current and incident wave condition will be compared and discussed in the next section.
3.2.2. Mutuality between the rip current and incident wave conditions
Beside morphological feature explained previous section, incident waves are important factor to the rip current. To infer relation between wave conditions and occurrence of the rip current, breaking wave height, breaking angle, and wave period for cases occurring the rip current were collected at breaker line and averaged, and compared to occurrence frequencies of the rip currents, respectively.
Fig. 8 shows relation between wave breaking height and occurrence frequencies of the rip currents. Occurrences of rip currents are proportionate to breaking height up to around 0.7 m, after then are disproportionate to breaking height. As a result, convex mutuality of them indicates that occurrence rate of the rip current may be decreased after threshold of breaking height. High wave must be broken at offshore, i.e., surf zone is extend to offshore and shoreward wave energies may be enough strong to restrain generations of the rip current. This aspect suggests that bathymetrical difference in various beach may be contribute to occurrence of the rip current.
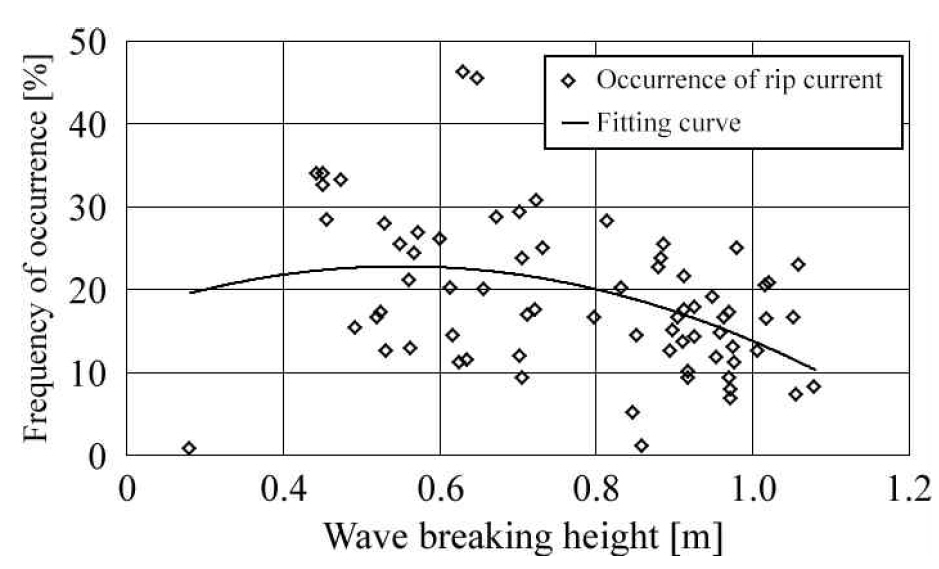
Relation between wave breaking height and rip current occurrence.
Fig. 9 delineates relation between occurrences of the rip currents and wave periods. Occurrences of the rip currents are concentrated 6 ~ 8 second and are decreasing while wave periods are increasing. It can be understood with respect to energy, as described at previous breaking wave paragraph, meaning that wave energies are enough to restrain generation of the rip current.
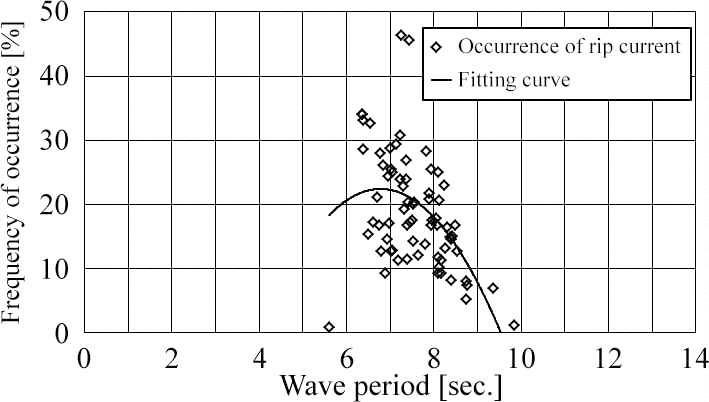
Relation between wave period and rip current occurrence.
Fig. 10 shows relations between occurrence rates of the rip currents and breaking angles, and signifies that about 60 % of the rip currents occur between 0 ~ 15 degree, and maximum frequency is scope from 0 to 10 degree, which implies that rip currents occur more frequently with normal incidence than oblique incidence.

Relation between wave breaking angle and rip current occurrence.
As a result, conditions appearing the rip current at Jungmun Beach are highlighted the wave breaking heights are 0.5 ~ 0.7 m, wave periods are 6 ~ 8 second, and breaking angles are 0 ~ 15 degree, indicating that there are appropriate incident wave conditions to generate the rip current at Jungmun Beach.
Reinhart and Pfaff (2016) examined the local wave characteristics associated with the rip current at Wrightsville beach, North Carolina, USA from 2009 to 2013 by analyzing observations. Primary outcomes of them stand for that majority of wave height related with the rip current is 0.7 m, wave directions within ± 10° of shore normal, and wave period are around 6 second. Outbreaks of the rip currents are proportionate to wave height up to around 1 m after then are disproportionate to wave height, and similarity with respect to wave period and wave direction are revealed. Trends of outbreaks of the rip currents are also similar with those of this study.
Occurrence conditions of the rip current cannot be generalized because they are closely associated the localized wave characteristic and morphology. Therefore, it is needed to figure out rip current pattern and its occurrence at Jungmun Beach by sustainable researches and observations and to consistently educate people to avoid drownings related with the rip current, because the rip current is possible to become lethal hazard to swimmers visiting Jungmun Beach.
4. Conclusions and remarks
This study tried to identify the nearshore current and the rip current patterns at Jungmun Beach by numerical computation in year of 2015. In Jungmun Beach, SSE type waves had been prevailed. Wave heights are generally lower than 1.5 m at Jungmun Beach excepting several stormy conditions.
The results of analyses indicate that rip currents are frequently generated at Jungmun Beach. Major reasons why rip current have often occurred at the beach may be rip-channel and beach type, as headland-bay or pocket beach.
Through comparison between outbreaks of the rip currents and incident wave conditions, rip currents are often generated with breaking height around 0.5 ~ 0.7 m, wave period around 6 ~ 8 second, and breaking angle around 0 ~ 15 degree.
The results of this study suggest that sustainable researches and observations will be needed to avoid drownings of beachgoers at Jungmun Beach. Also, further researches for several and various type of beaches and incident wave conditions are needed to obviously identify relation among the rip current, incident wave condition, and beach types as well as Jungmun Beach.
Acknowledgement
This research was supported by the 2016 scientific promotion program by Jeju National University.